Block graphic 2
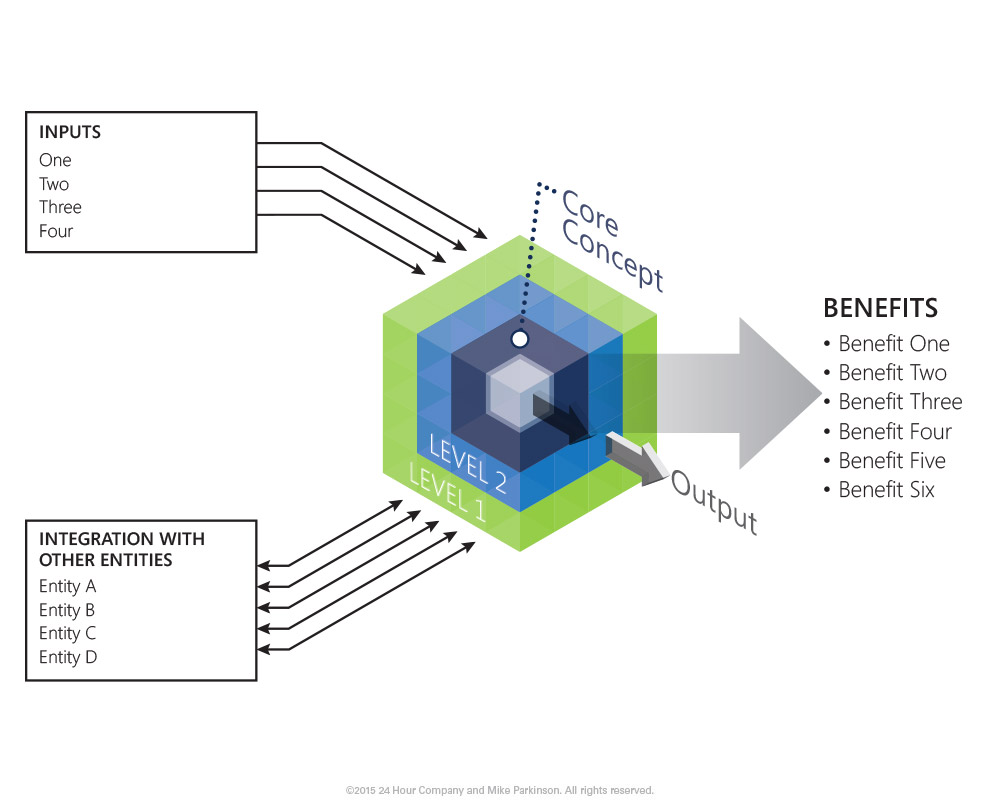
Use this Block graphic to show how elements work together.

Use this Block graphic to show how elements work together.
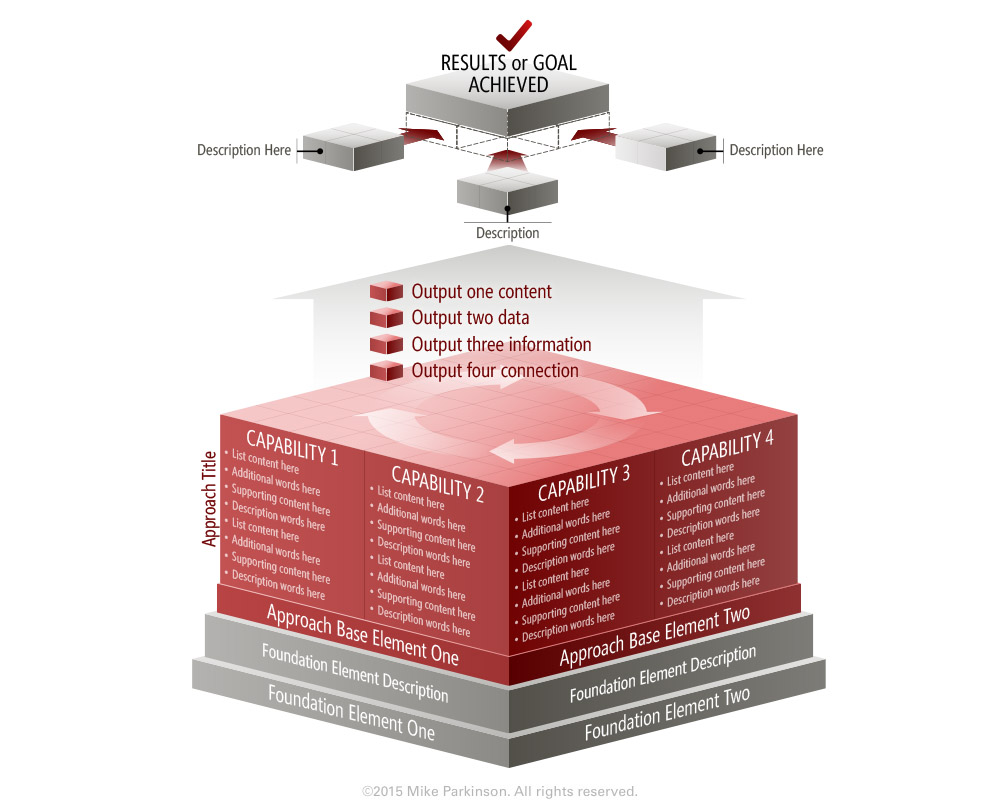
Use this Block graphic to show how elements work together.
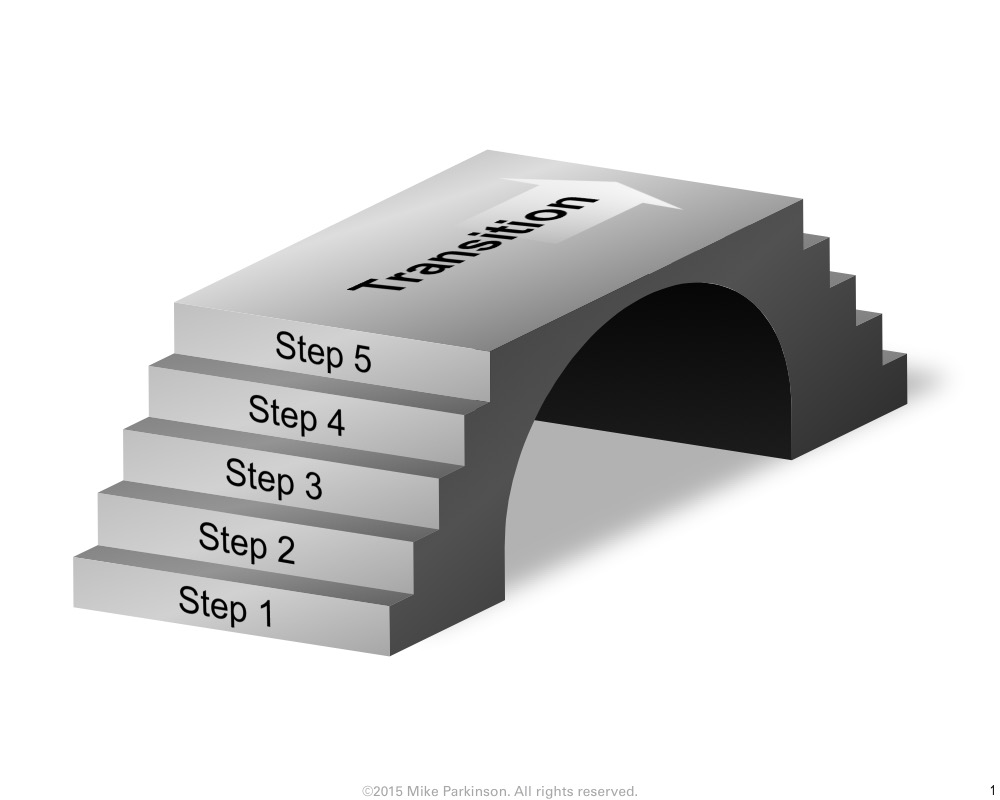
Use this Bridge Graphic as a graphic metaphor to depict the connection or transition between two actions, concepts, or entities.
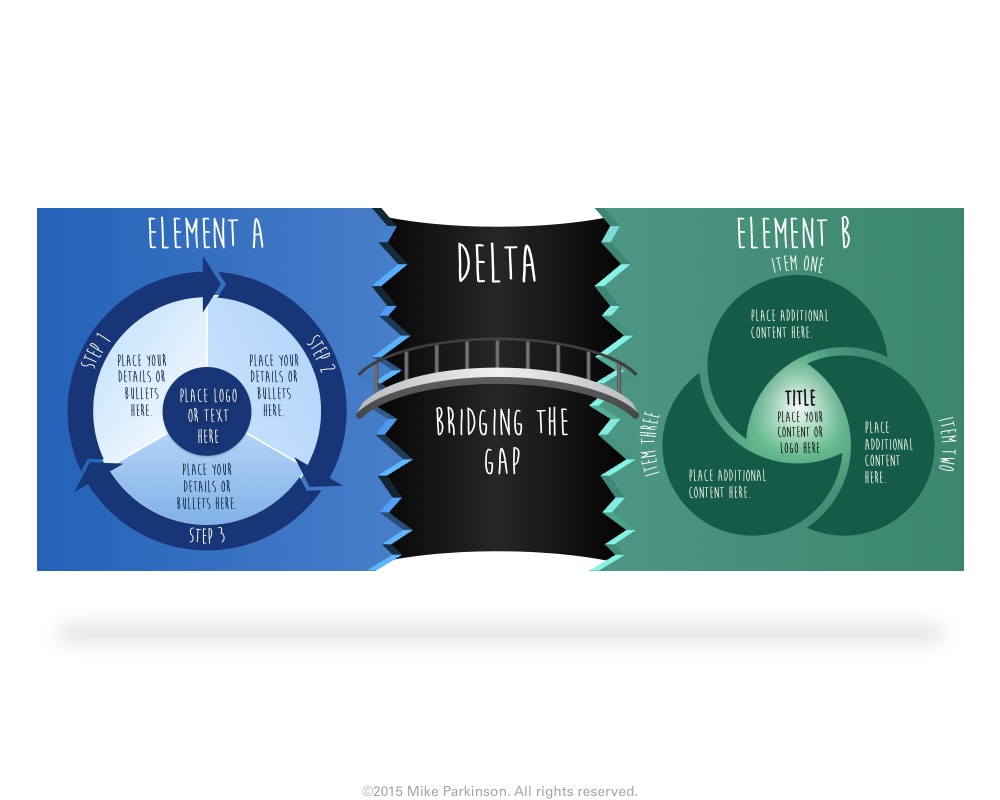
Use this Bridge Graphic as a graphic metaphor to depict the connection or transition between two actions, concepts, or entities.
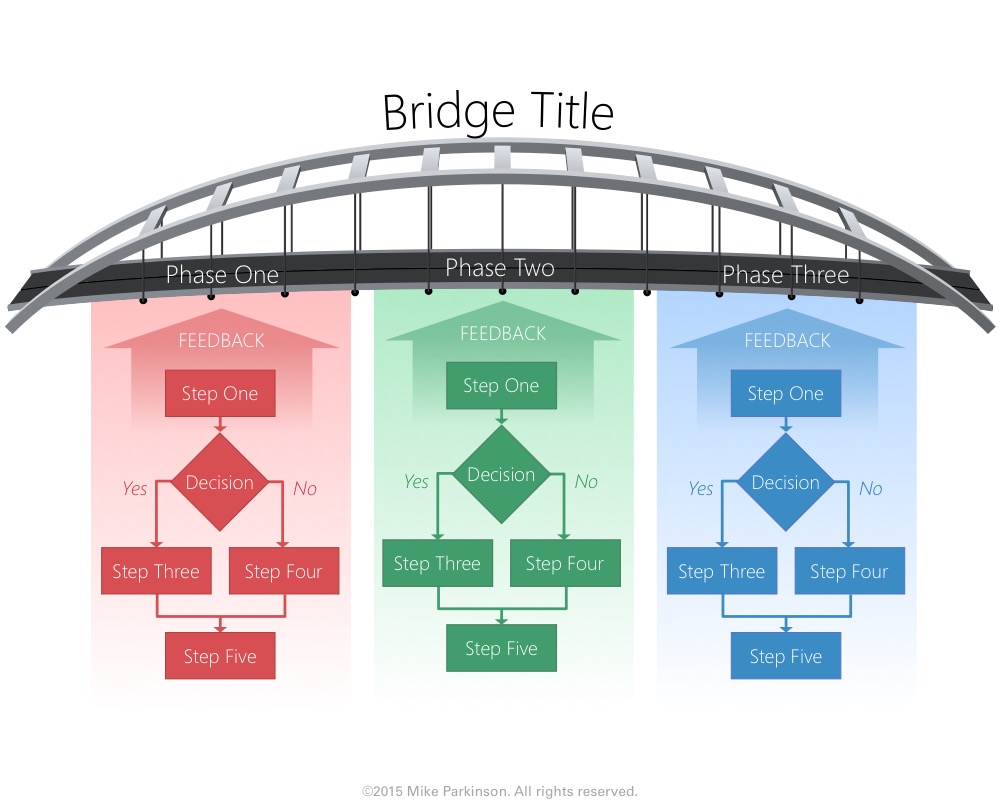
Use this Bridge Graphic as a graphic metaphor to depict the connection or transition between two actions, concepts, or entities.
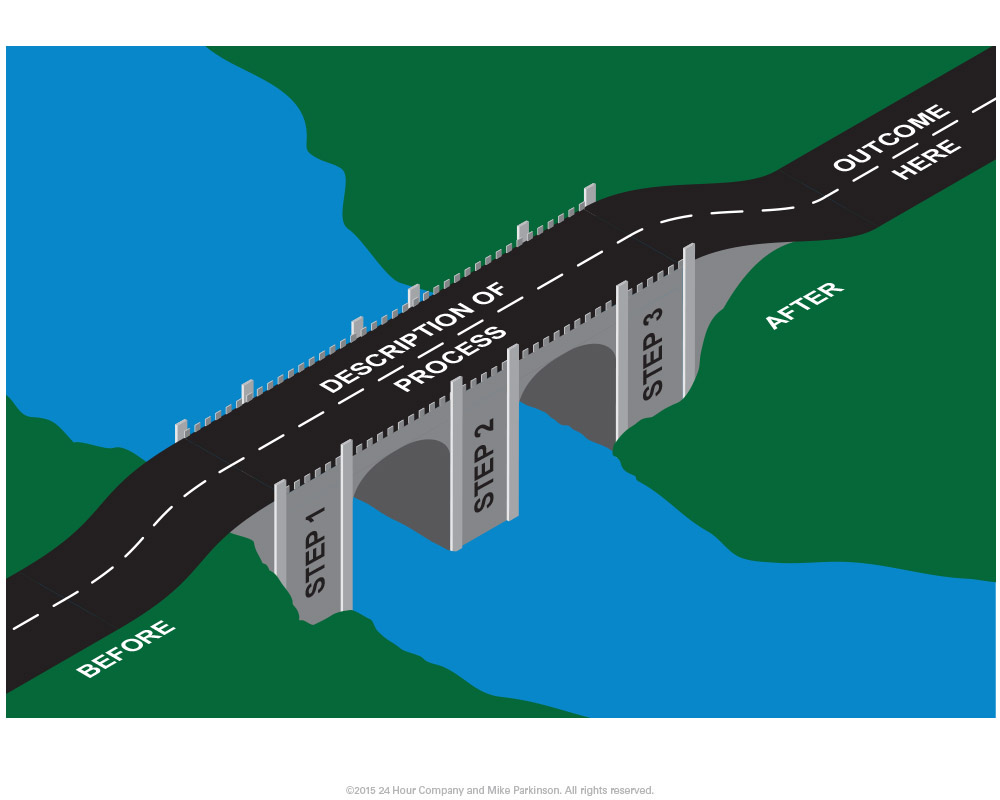
Use this Bridge Graphic as a graphic metaphor to depict the connection or transition between two actions, concepts, or entities.
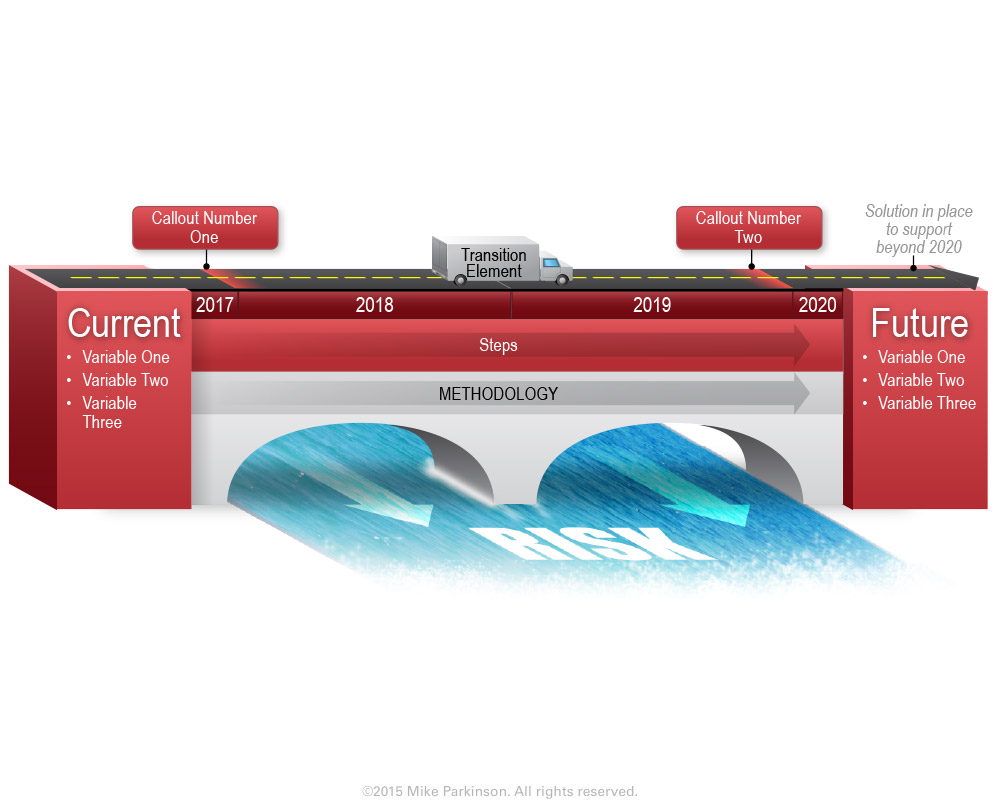
Use this Bridge Graphic as a graphic metaphor to depict the connection or transition between two actions, concepts, or entities.
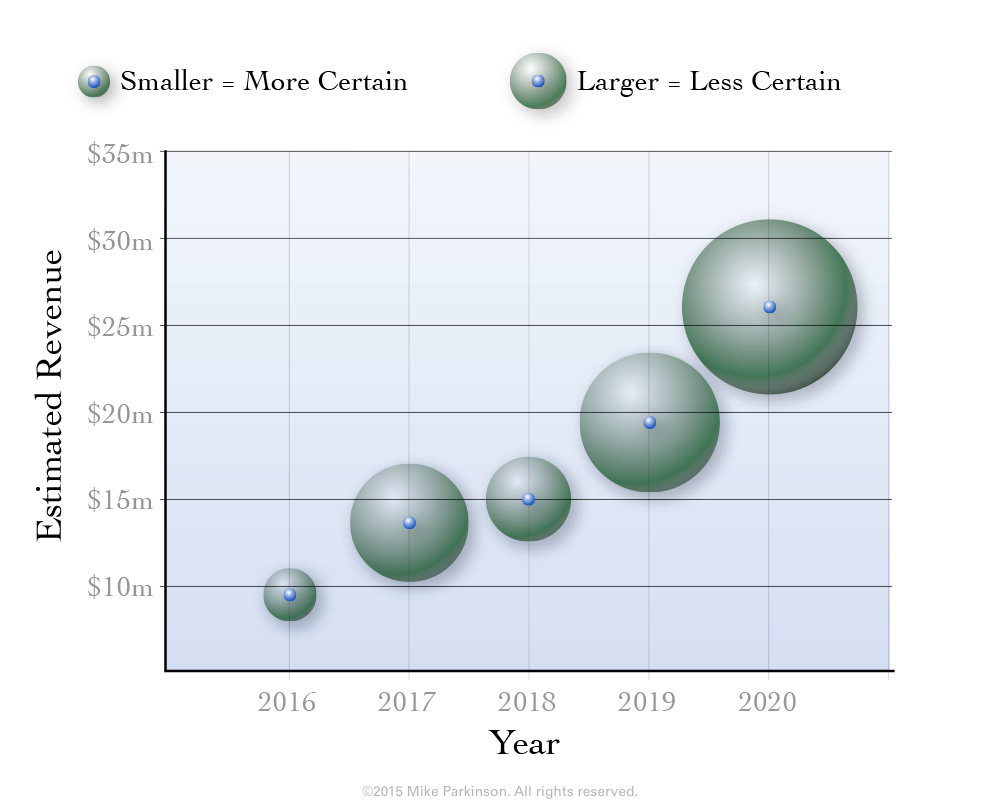
Use this Bubble Chart graphic to show amounts, values, and time. This graphic is data driven.
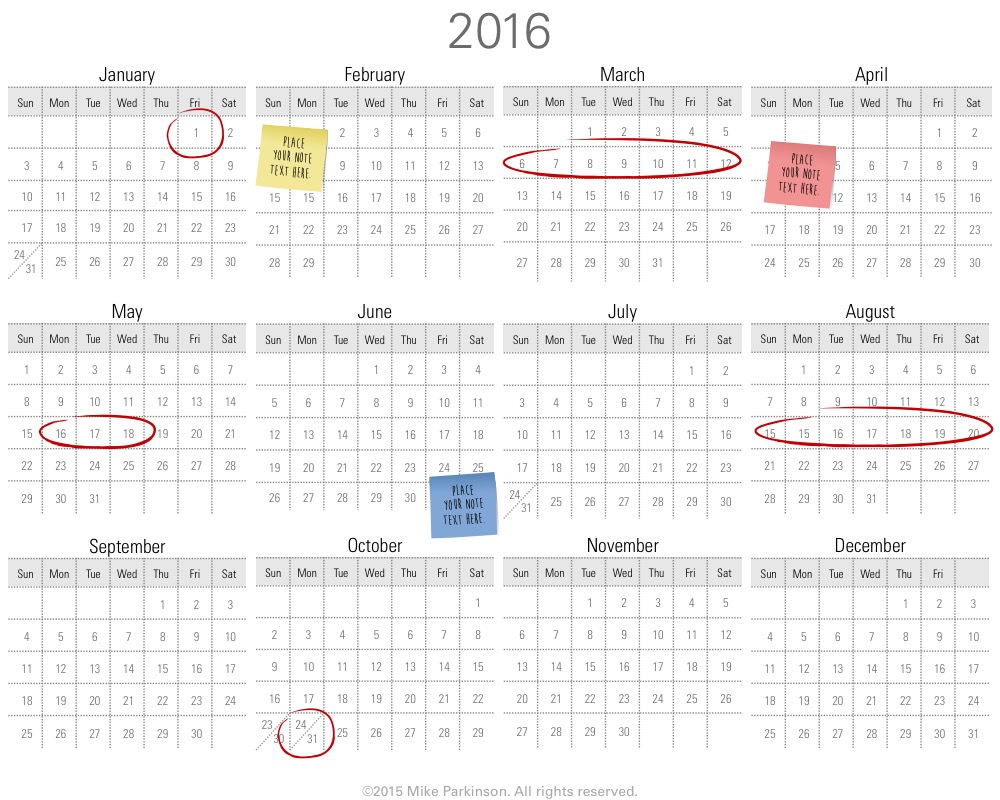
Use this Calendar to show schedules, events, and activities.
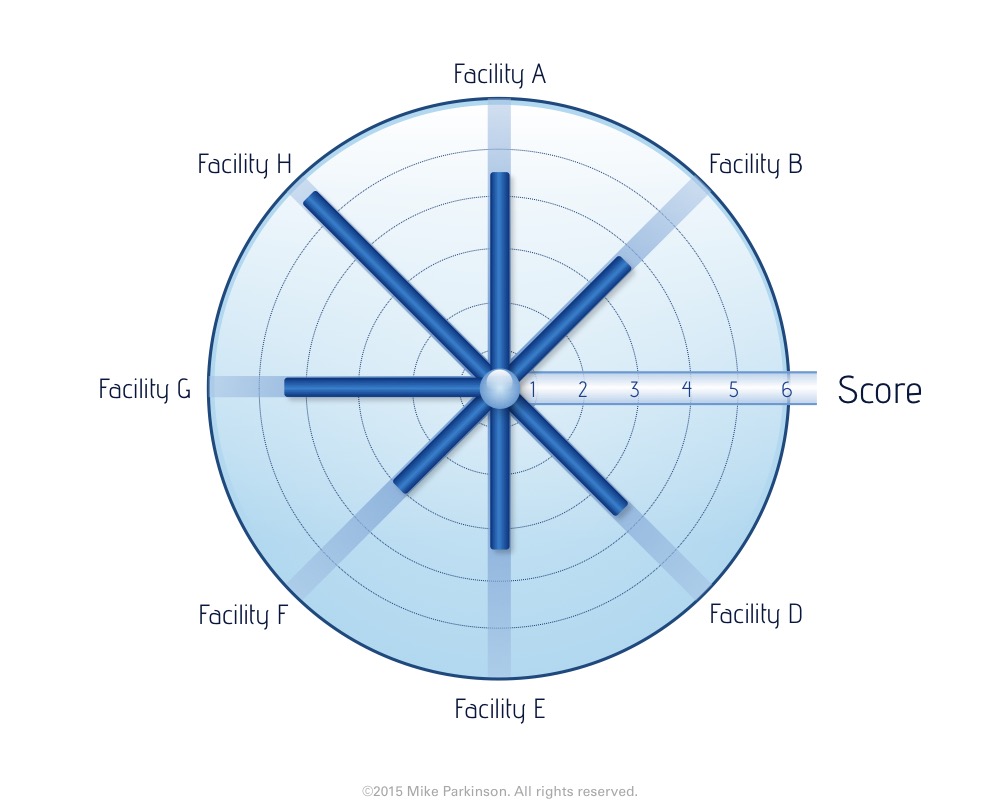
Use this Circle Chart to show changing amounts, values, or time. (This graphic is NOT data driven.)

Use this Circle Chart to show changing amounts, values, or time. (This graphic is NOT data driven.)
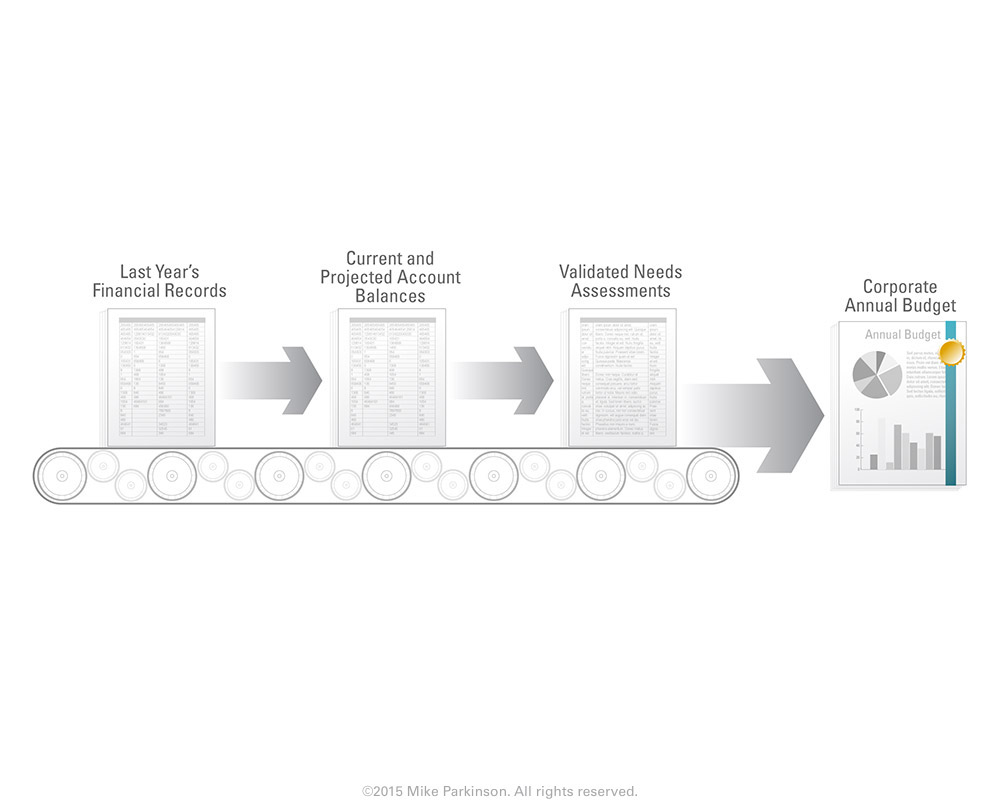
Use this Conveyor Belt Graphic to illustrate a repeatable linear process.