Related Projects
Bar Chart Curved
Use this Bar Chart to show amounts, values, and time.
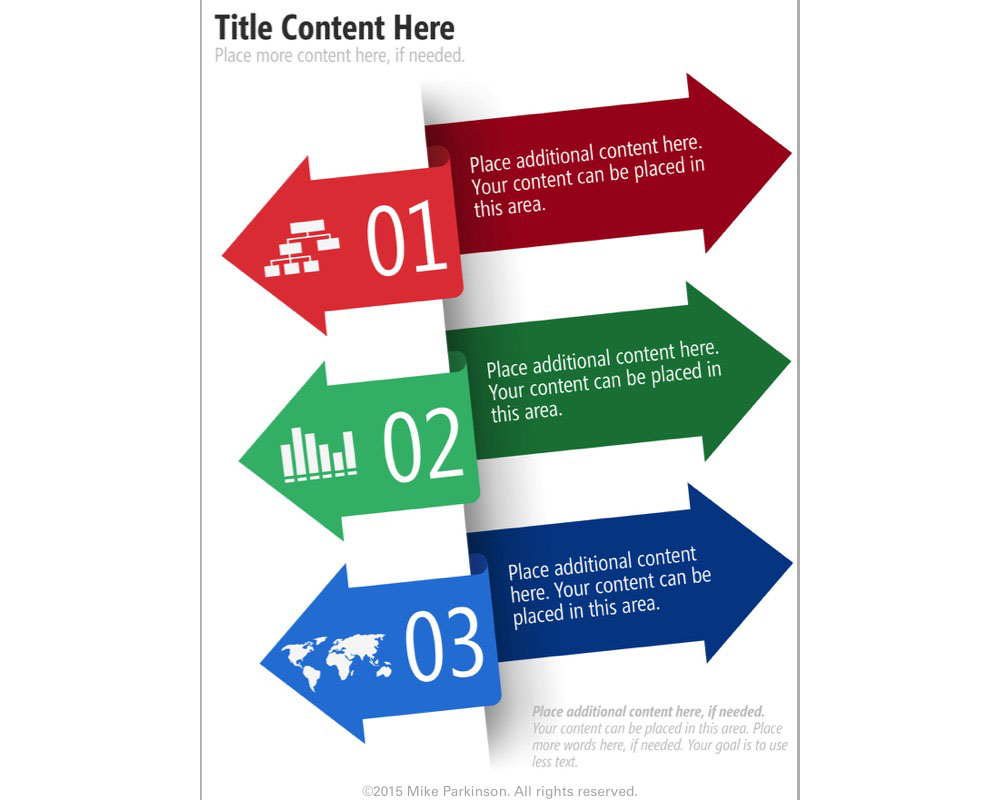
Icons – Arrows
Use these Icons in Infographics or other graphic types to dynamically show movement and transition to a future state.
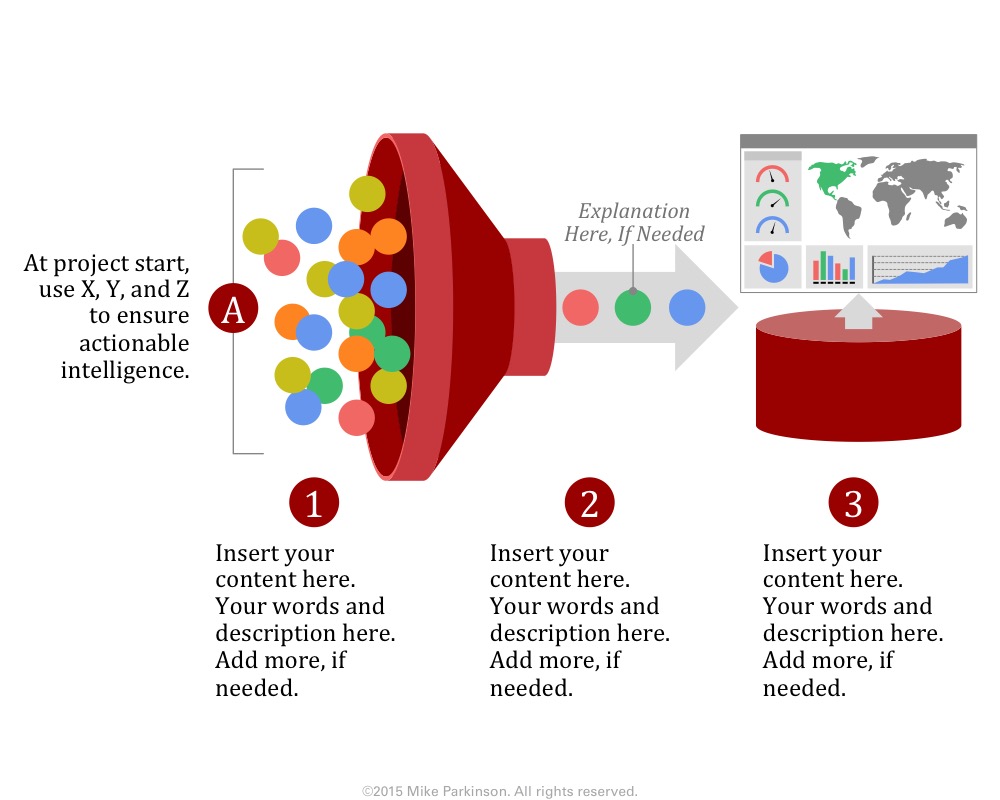
Funnel Graphic 8
Use this Funnel Graphic as a metaphor showing the passing of elements through a conduit (the funnel) resulting in the…
Infographic 10
Use this Infographic to share quantitative data related to a specific topic.


