Graphic Description
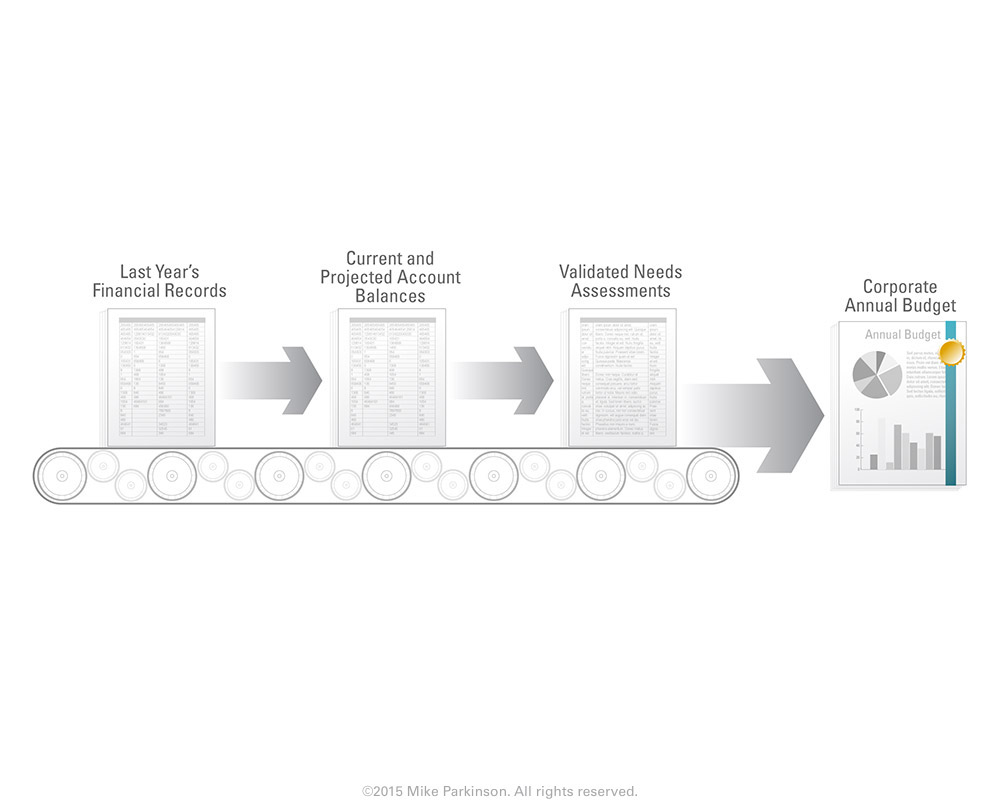
Use this Conveyor Belt Graphic to illustrate a repeatable linear process.

Use this Conveyor Belt Graphic to illustrate a repeatable linear process.

Use this Bar Chart to show amounts, values, and time.
Use these Icons in Infographics or other graphic types to dynamically show movement and transition to a future state.

Use this Funnel Graphic as a metaphor showing the passing of elements through a conduit (the funnel) resulting in the…

Use this Infographic to show how elements can nourish your ideas and help them fruit.