Funnel Graphic 8
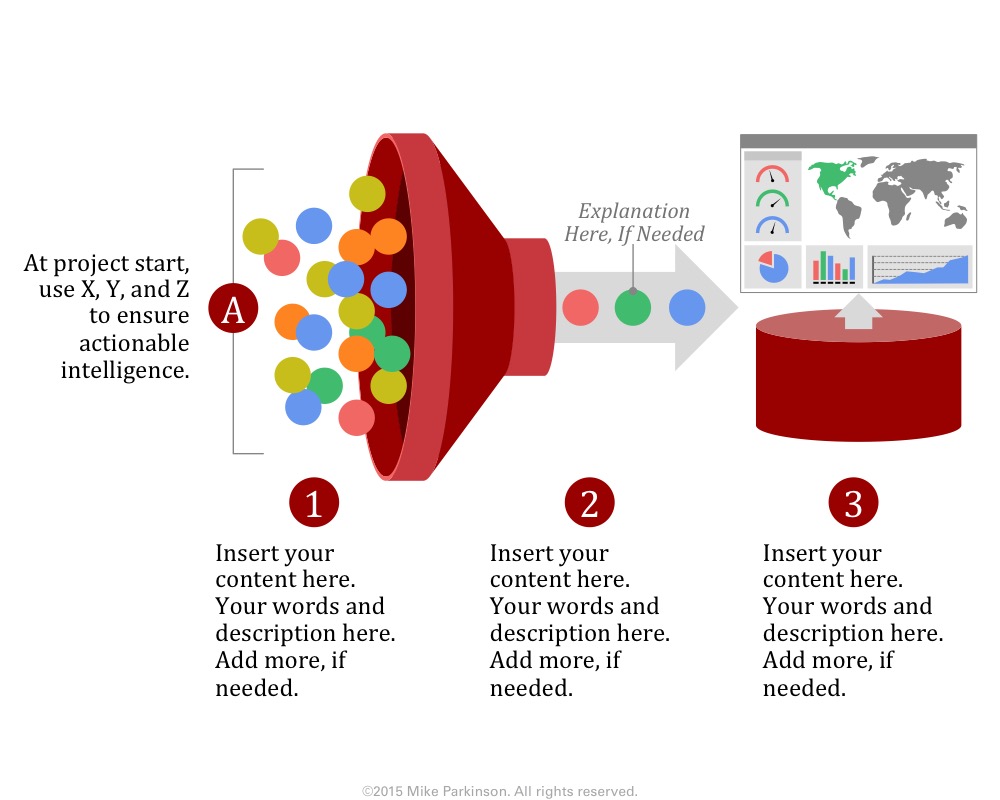
Use this Funnel Graphic as a metaphor showing the passing of elements through a conduit (the funnel) resulting in the…

Use this Funnel Graphic as a metaphor showing the passing of elements through a conduit (the funnel) resulting in the…

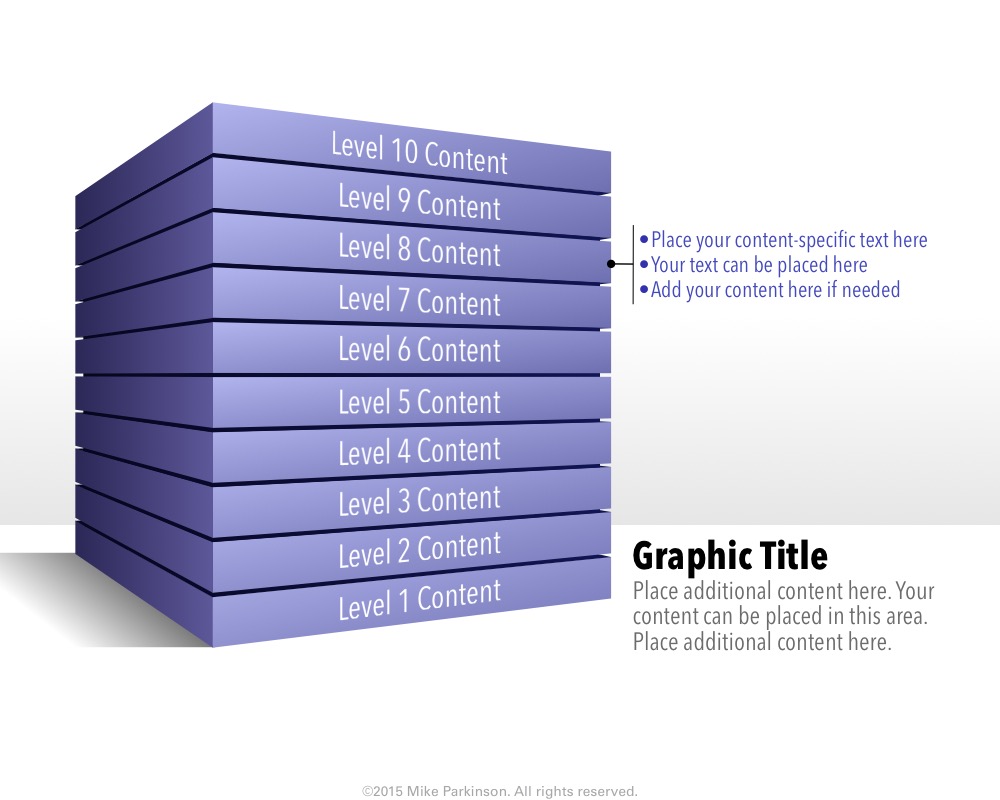
Use this Hexagonal Stacked Graphic to depict hierarchy, arrangement, structure, and/or relationship of a group of elements (e.g., an organization and…

Use this Venn Diagram to show the relationship and/or synergy of disparate elements through the overlap of those elements.
Use this Area Chart to show amounts, values, and time. This graphic is data driven.

Use this Area Chart to show amounts, values, and time. This graphic is data driven.
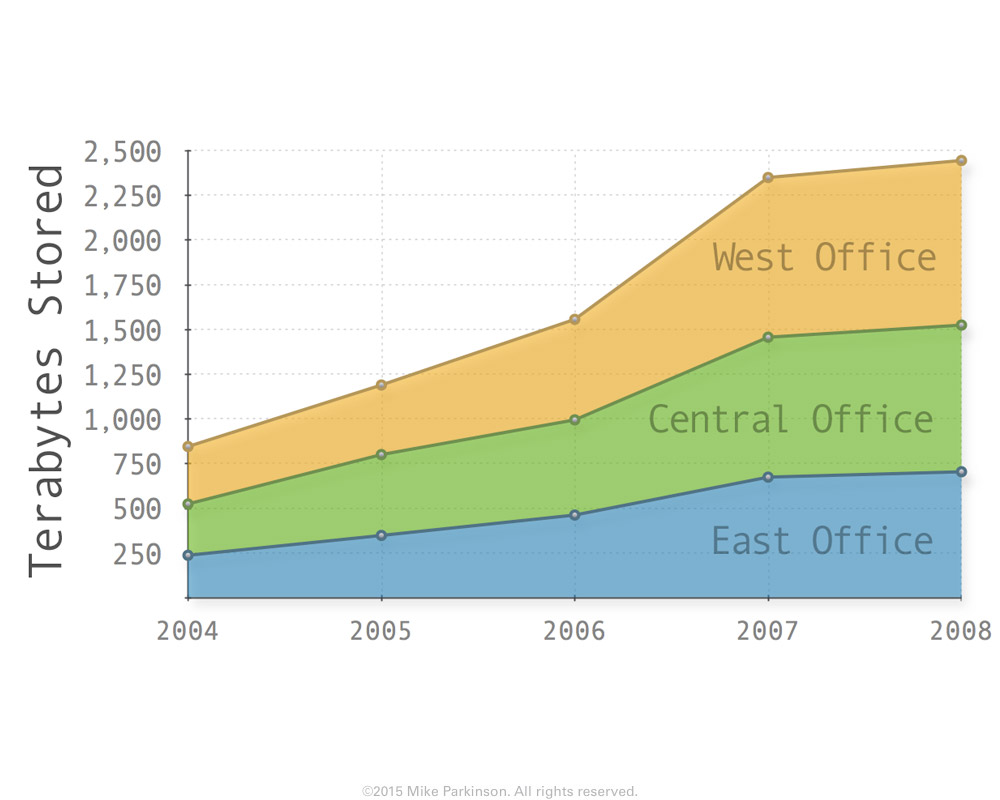
Use this Area Chart to show amounts, values, and time. This graphic is data driven.
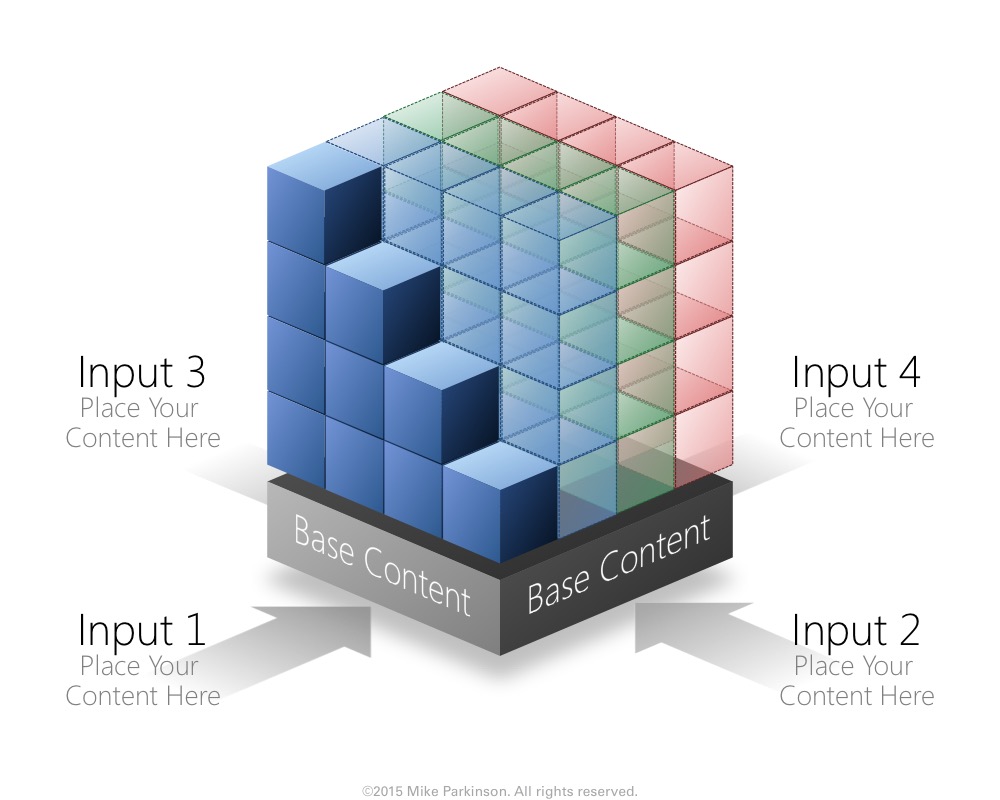
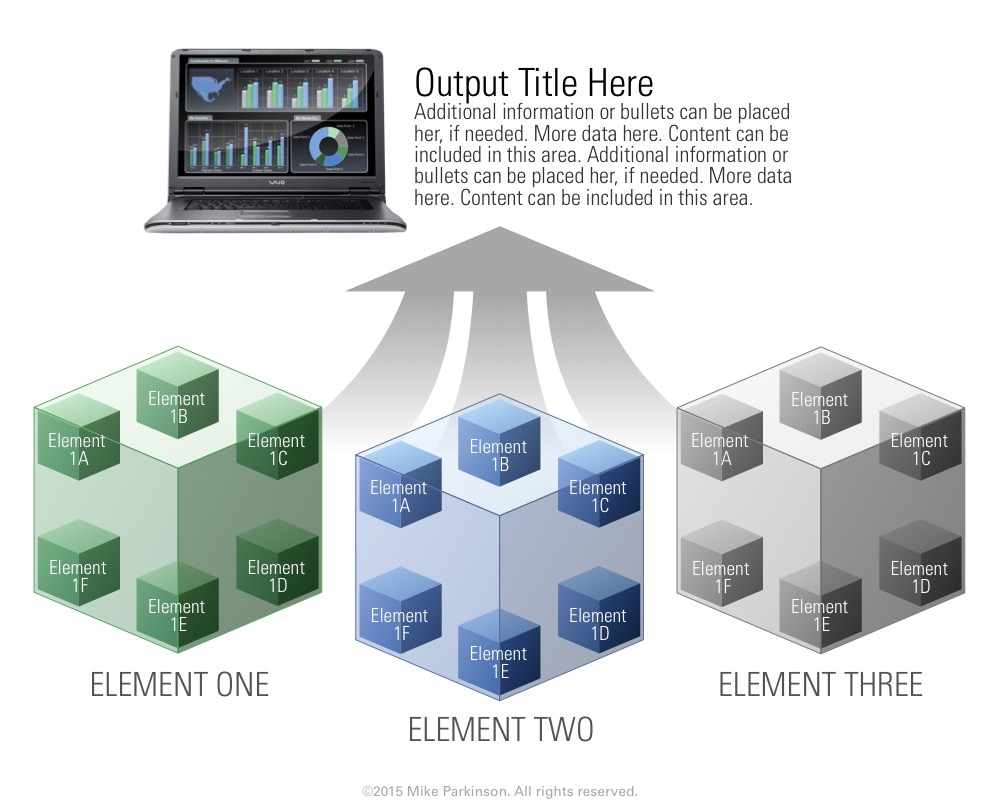
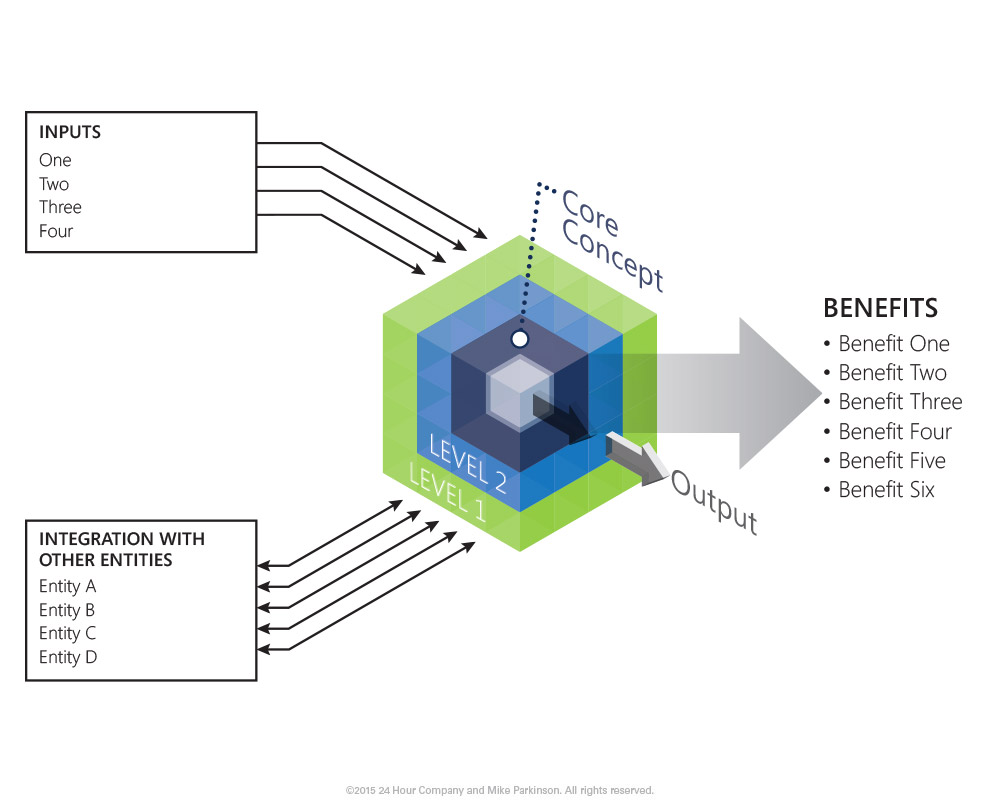
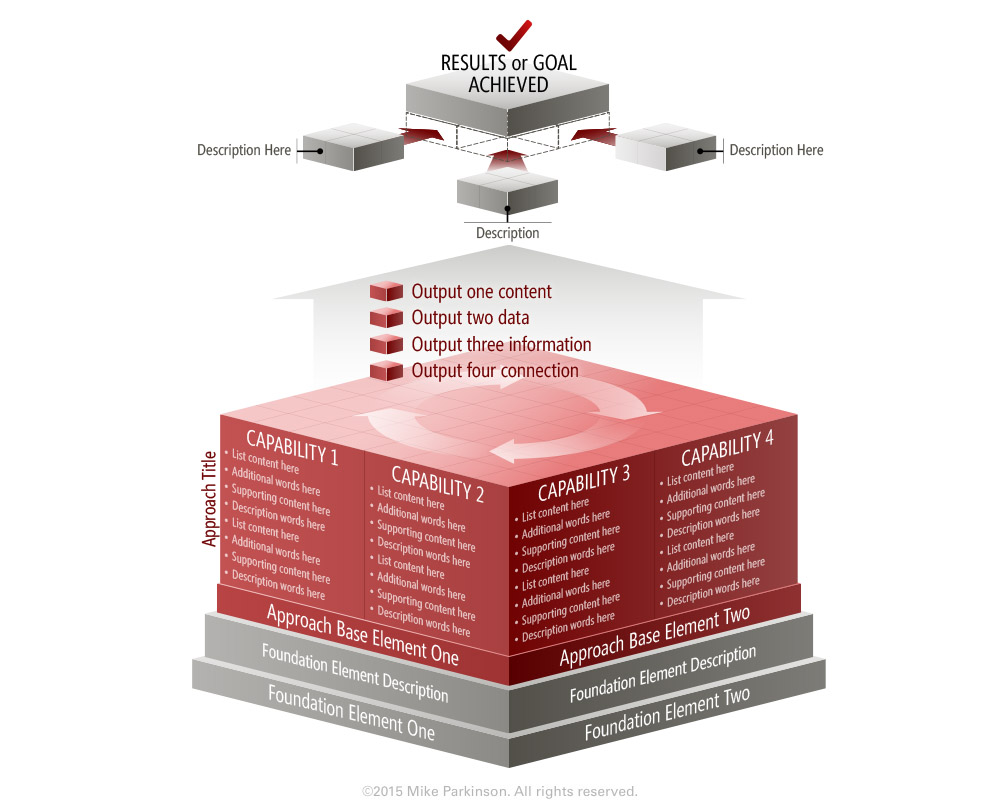
Use this Block graphic to show how elements work together.
Use this Block graphic to show how elements work together.
Use this Block graphic to show how elements work together.
Use this Block graphic to show how elements work together.
Use this Block graphic to show how elements work together.
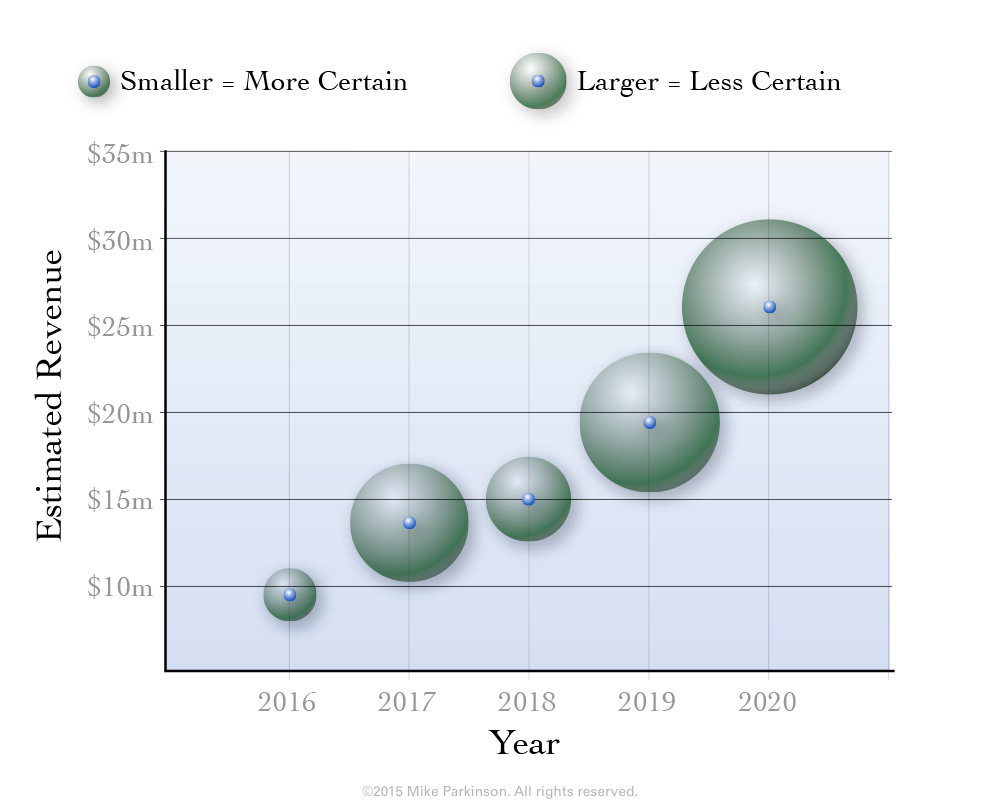
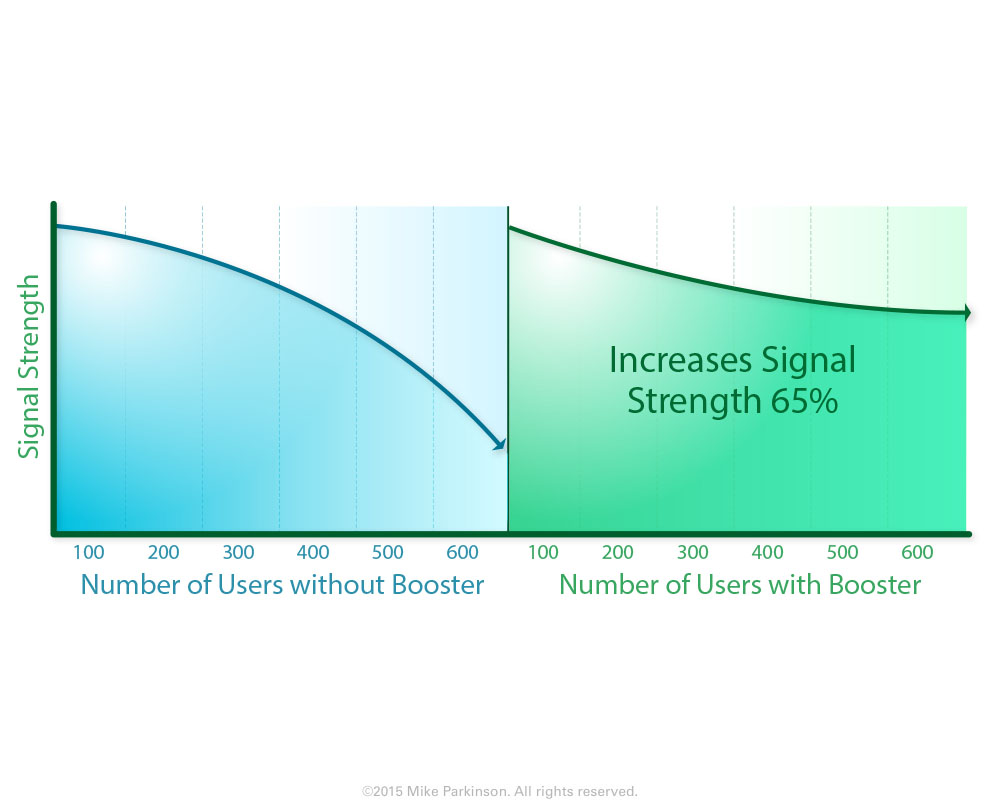
Use this Bubble Chart graphic to show amounts, values, and time. This graphic is data driven.