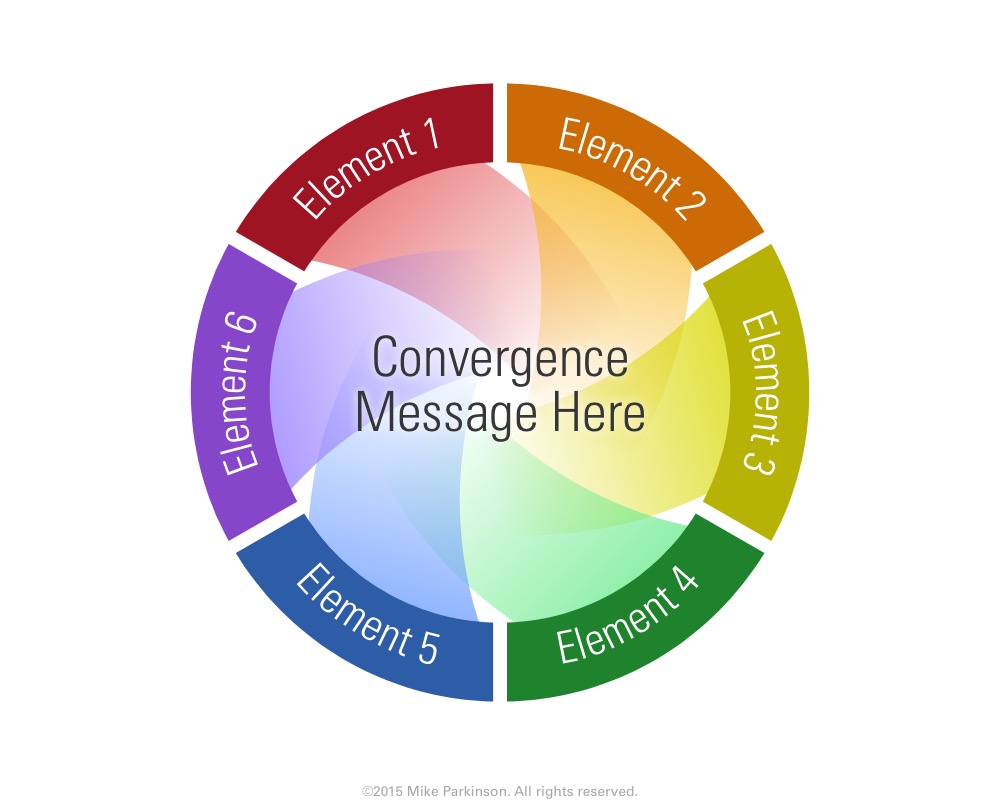
Venn Diagram 4
Use this Venn Diagram to show the relationship and/or synergy of disparate elements through the overlap of those elements.

Use this Venn Diagram to show the relationship and/or synergy of disparate elements through the overlap of those elements.
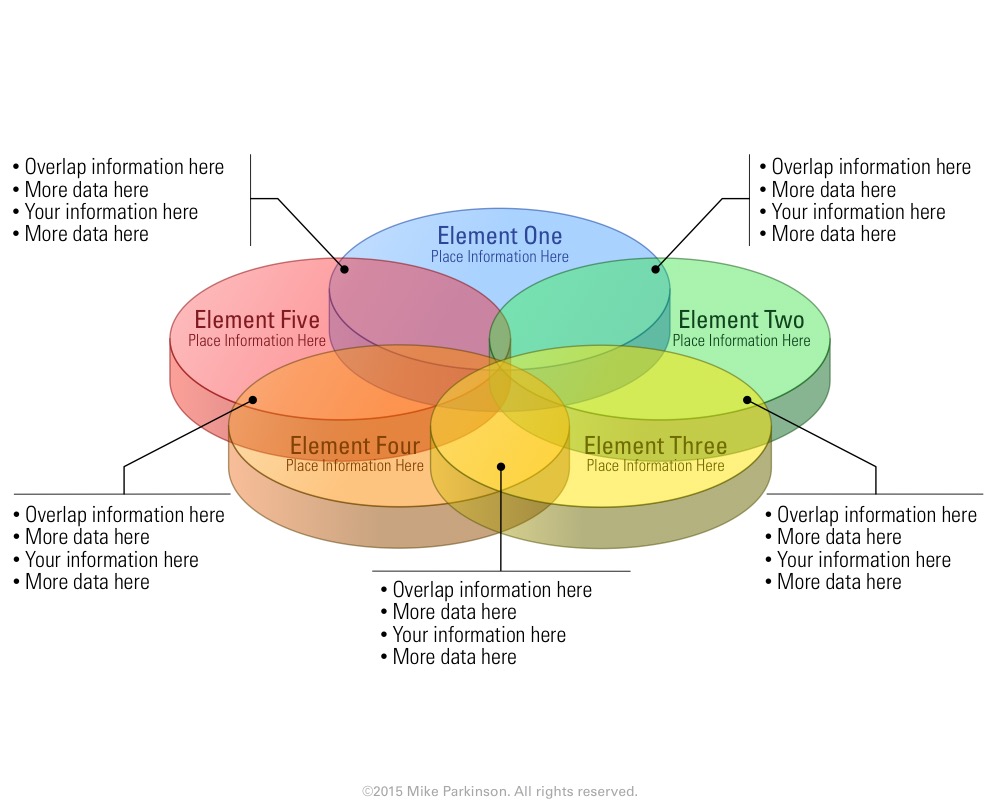
Use this Venn Diagram to show the relationship and/or synergy of disparate elements through the overlap of those elements.
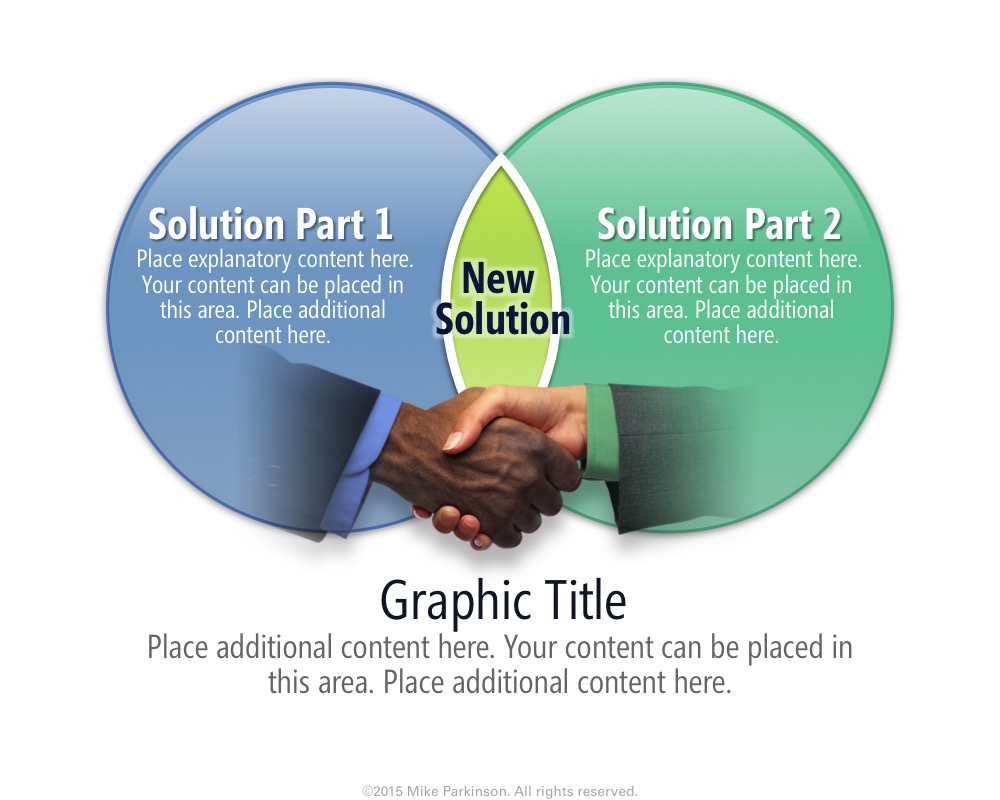
Use this Venn Diagram to show the relationship and/or synergy of disparate elements through the overlap of those elements.

Use this Venn Diagram to show the relationship and/or synergy of disparate elements through the overlap of those elements.
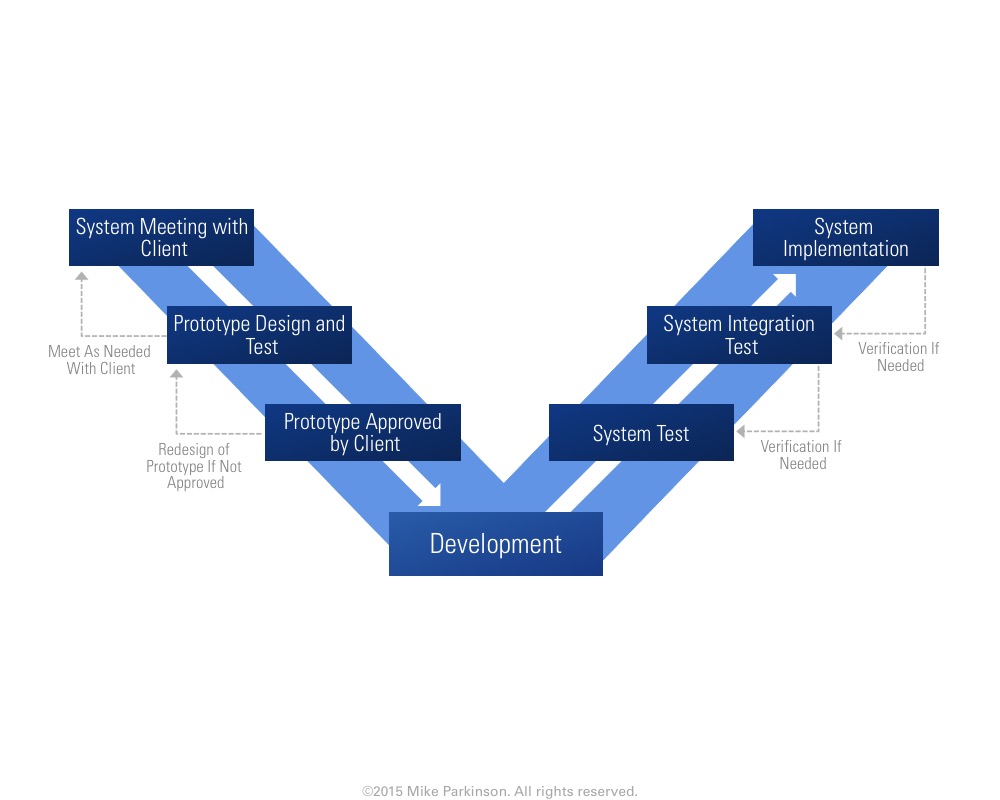
Use this Vee Diagram to illustrate relationships, and a process for validation and verification. (Also called an IV&V Diagram.)
Use this Timeline to show dates for any month. Highlight the month and days and use the blowouts for detail.
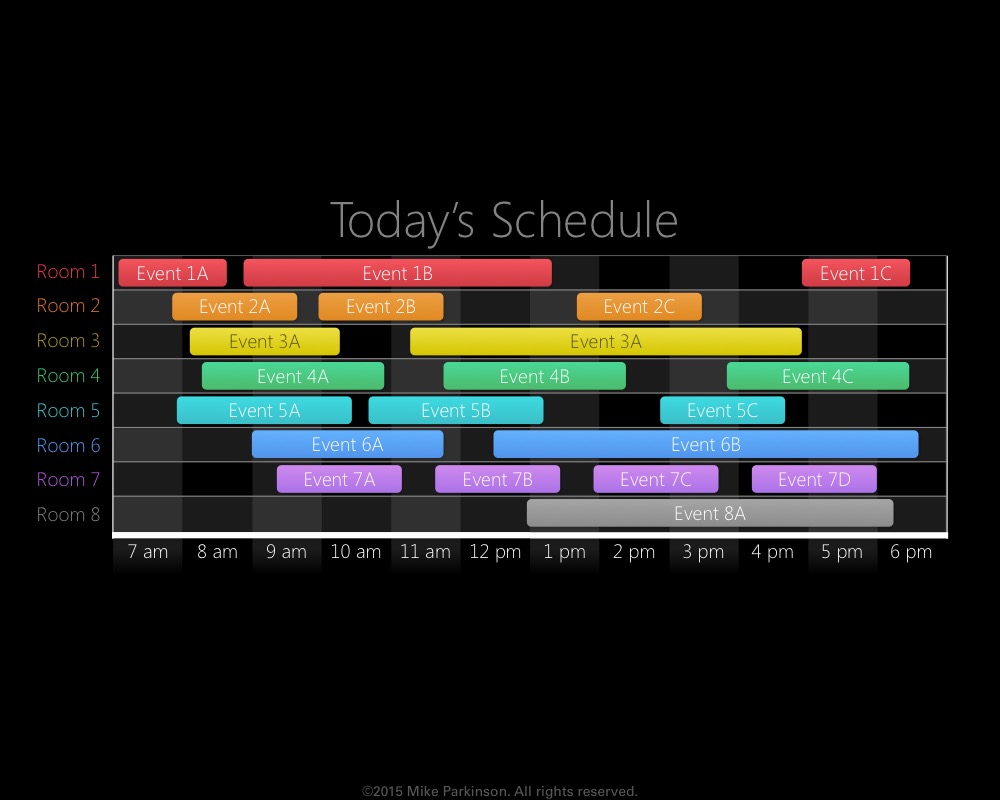
Use this Timeline to show dates for any month. Highlight the month and days and use the blowouts for detail.
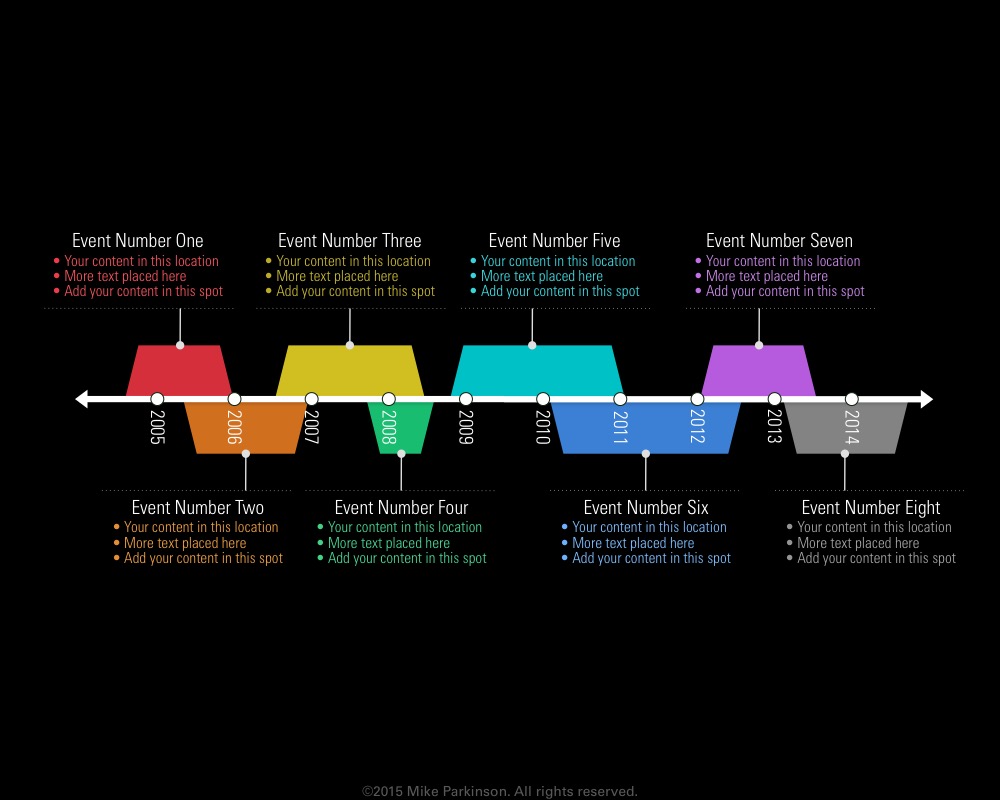
Use this Timeline to show dates for any month. Highlight the month and days and use the blowouts for detail.
Use this Timeline to show dates for any month. Highlight the month and days and use the blowouts for detail.

Use this Timeline to show dates for any month. Highlight the month and days and use the blowouts for detail.

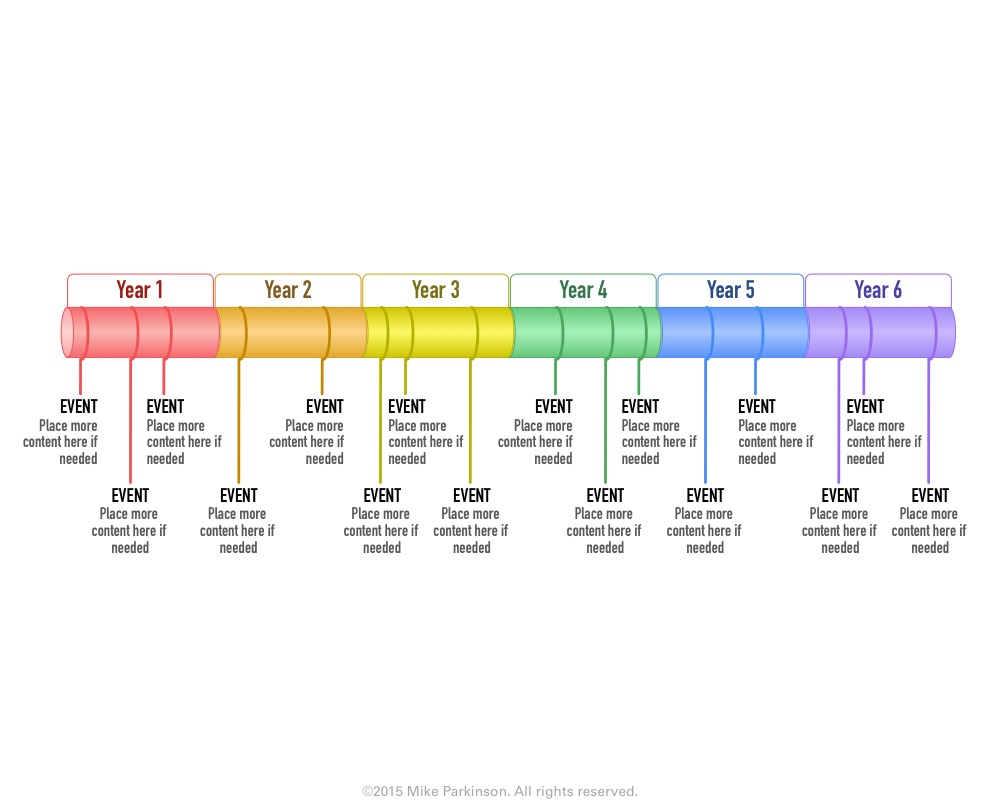
Use this split Timeline to show dates for any month. Highlight the month and days and use the blowouts for…
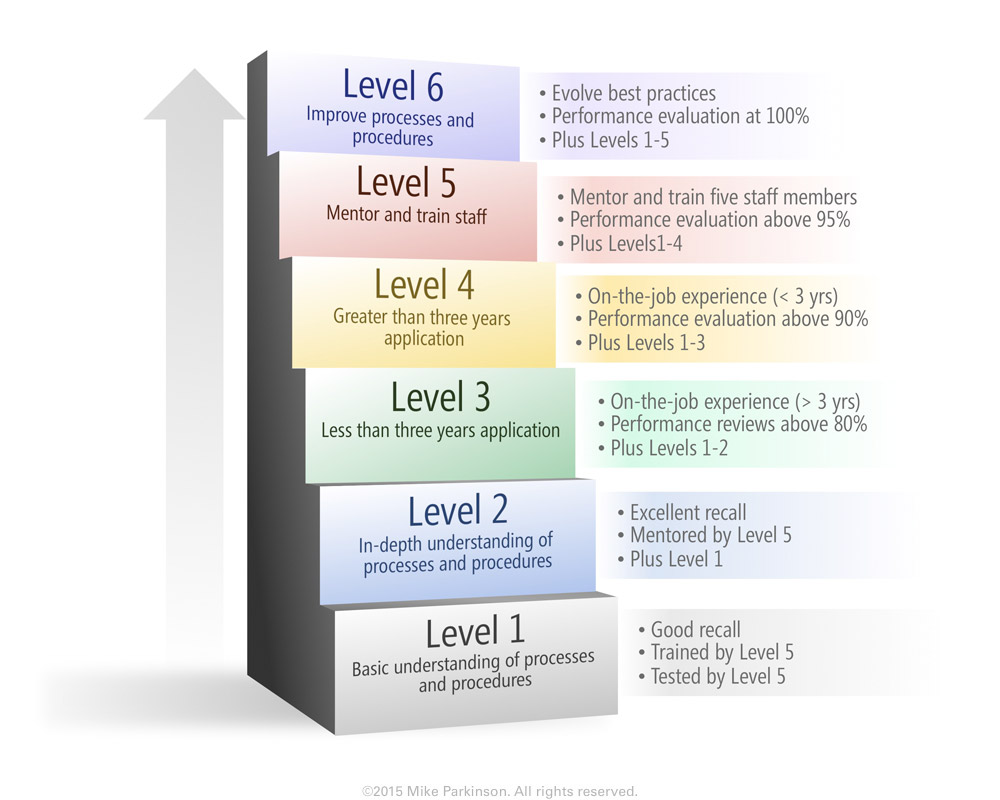
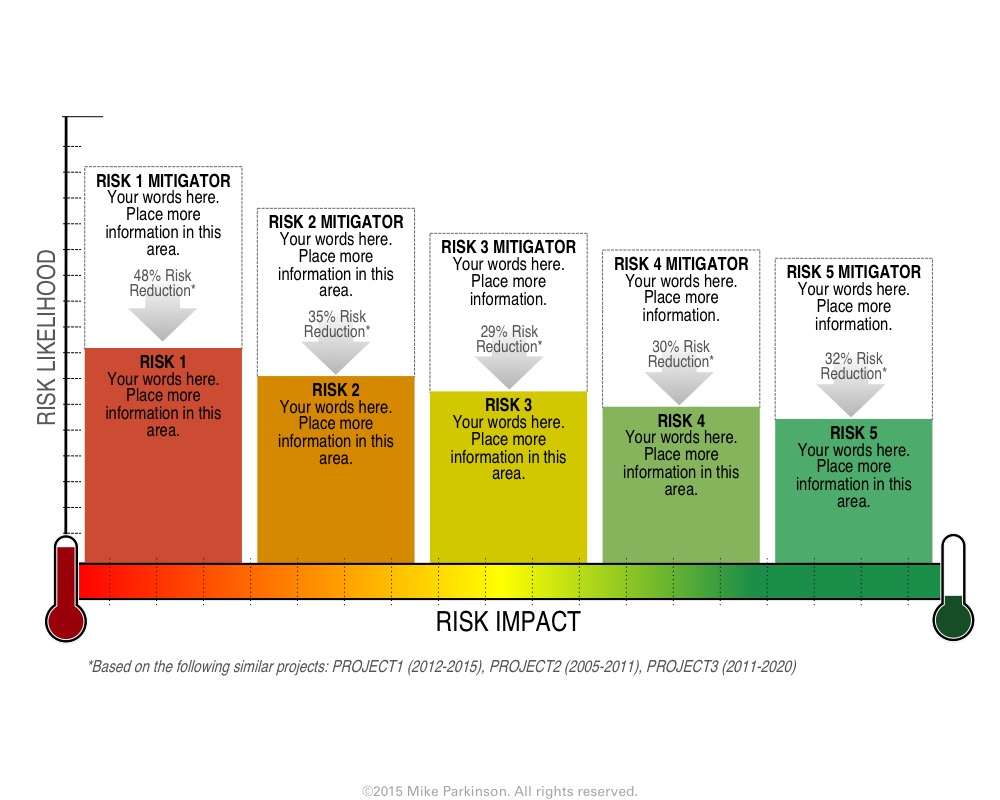
Use this Stair Graphic to show steps in a process, as a metaphor for progress, or to illustrate levels.