
Infographic
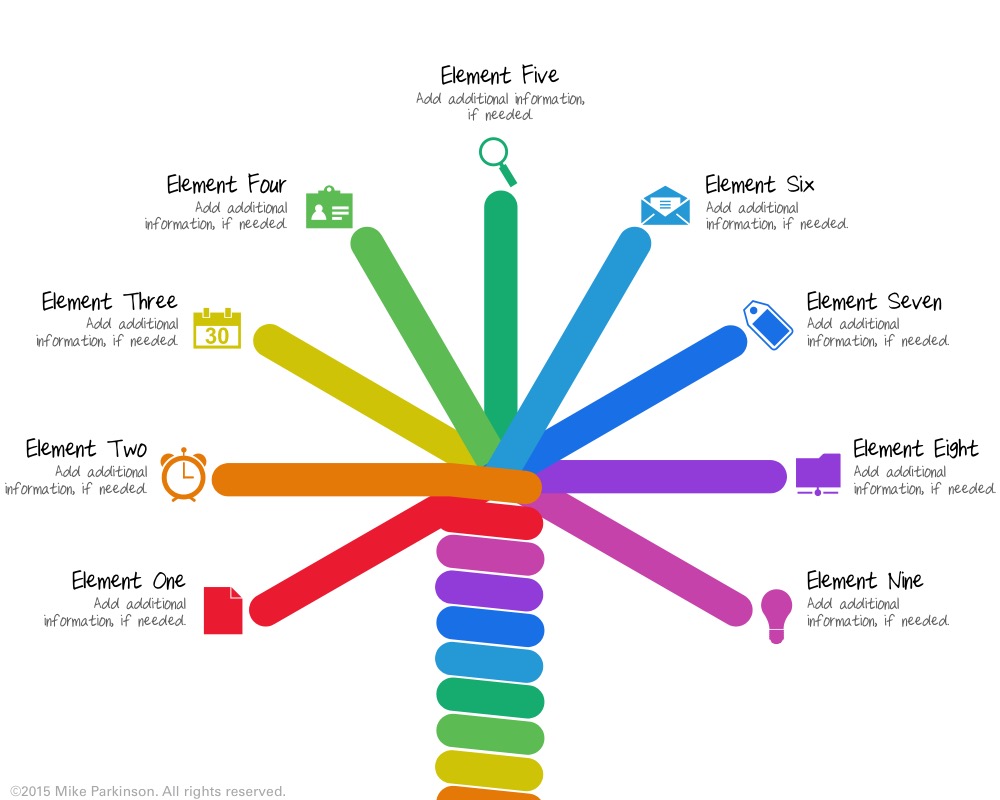
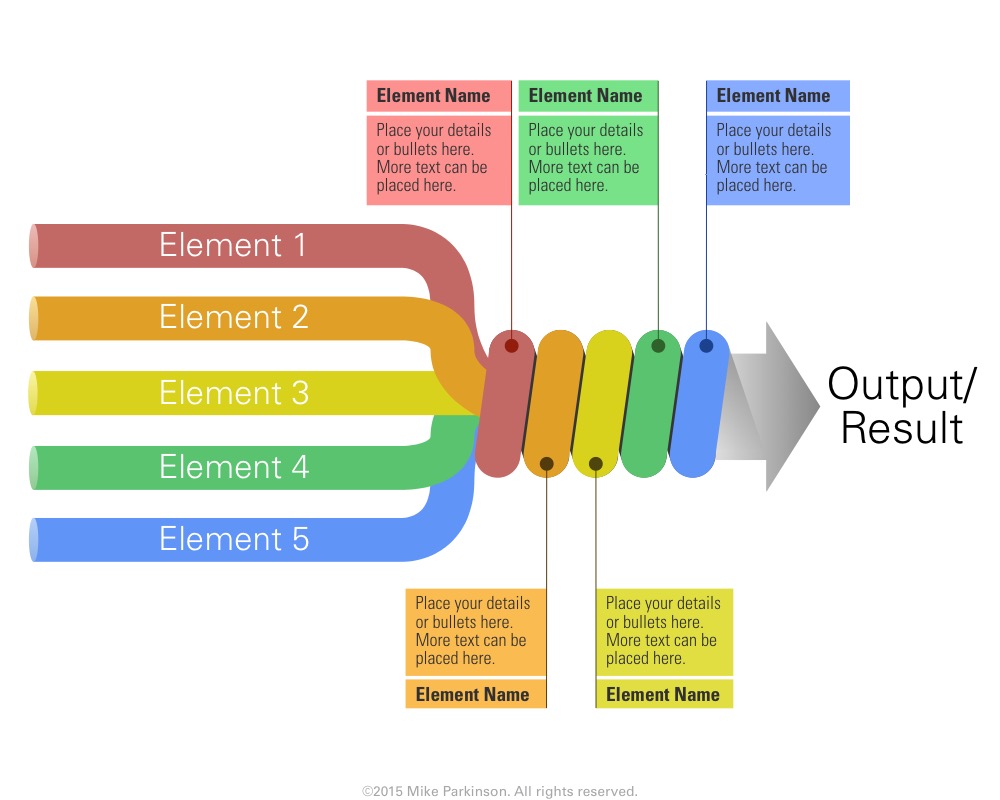
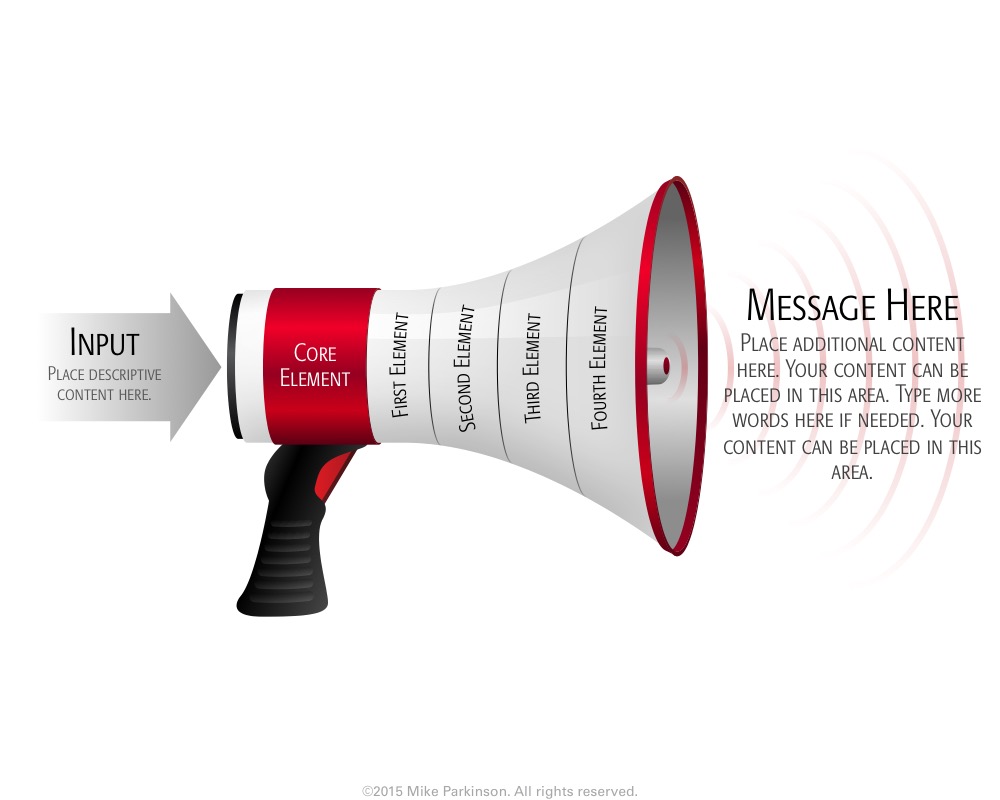
Use this Infographic to showcase interconnected information related to a specific topic.

Use this Infographic to showcase interconnected information related to a specific topic.
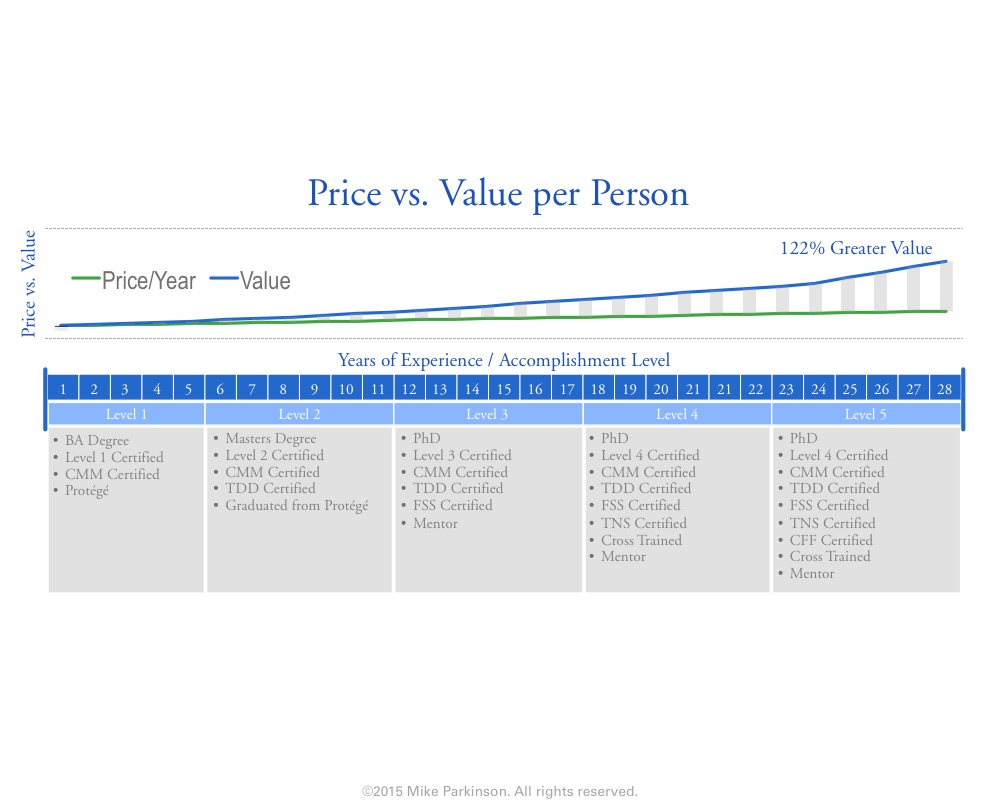
Use this Graph to show amounts, values, and time. This graphic is data driven.

Use this Graph to show amounts, values, and time. This graphic is data driven.
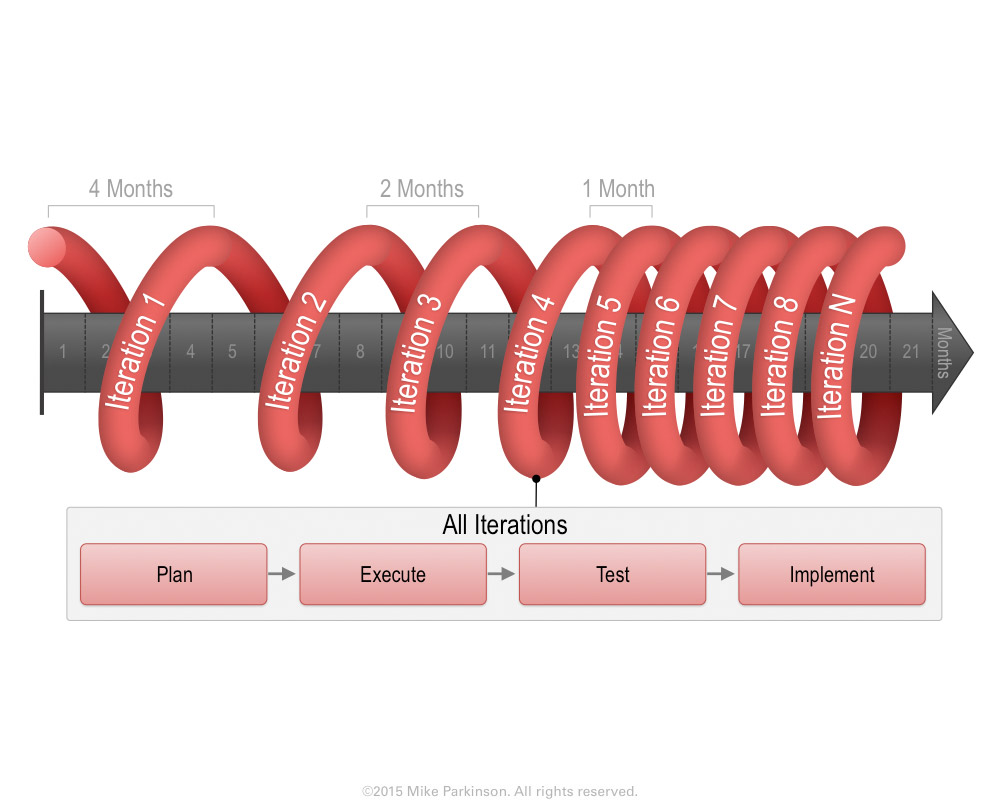
Use this Spiral Graphic as a metaphor that illustrates the evolution of an action, concept, or entity through a cyclical…
Use this Spiral Graphic as a metaphor that illustrates the evolution of an action, concept, or entity through a cyclical…
Use this Spiral Graphic as a metaphor that illustrates the evolution of an action, concept, or entity through a cyclical…
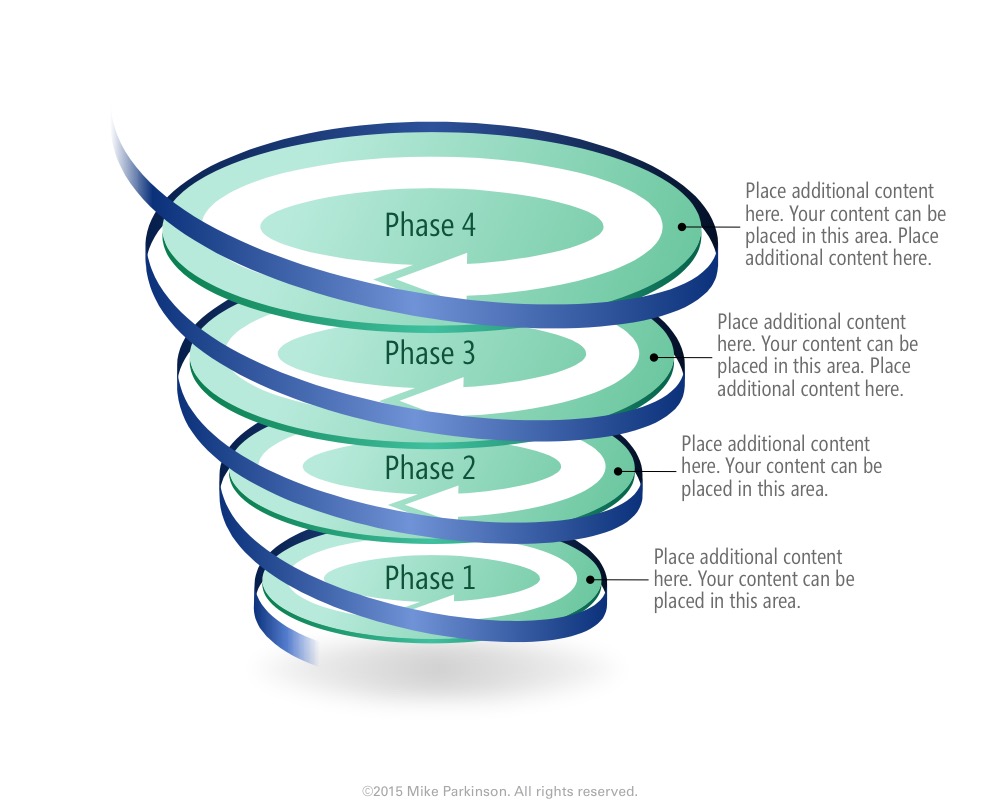
Use this Spiral Graphic as a metaphor that illustrates the evolution of an action, concept, or entity through a cyclical…
Use this Spiral Graphic as a metaphor that illustrates the evolution of an action, concept, or entity through a cyclical…
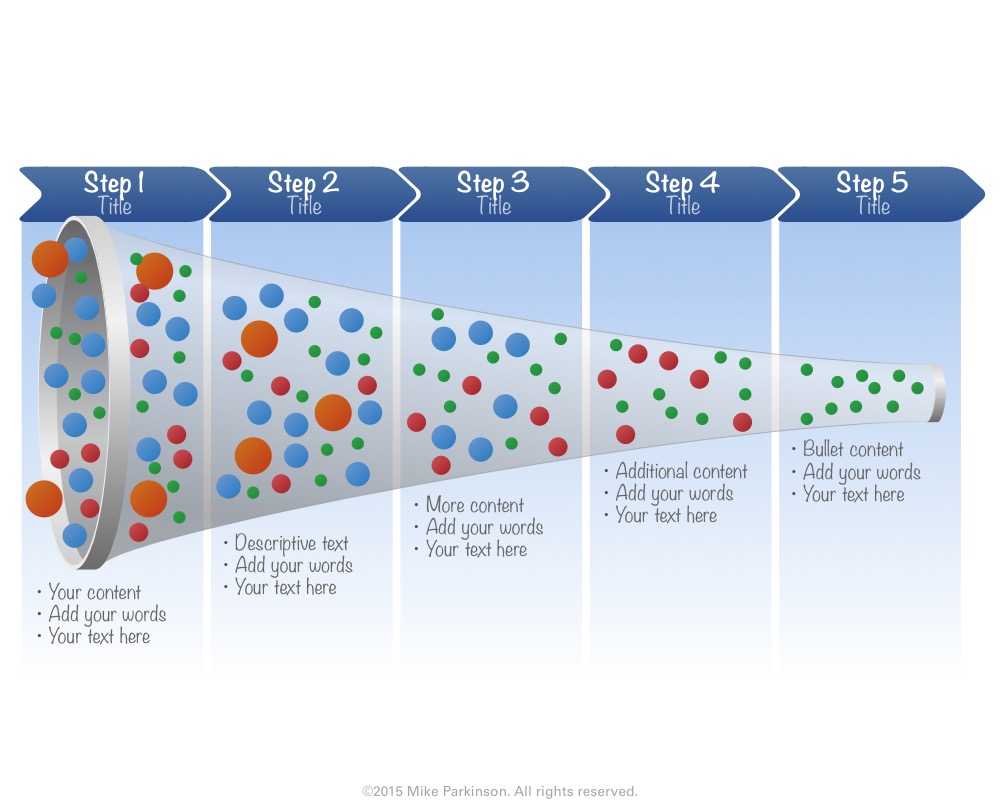
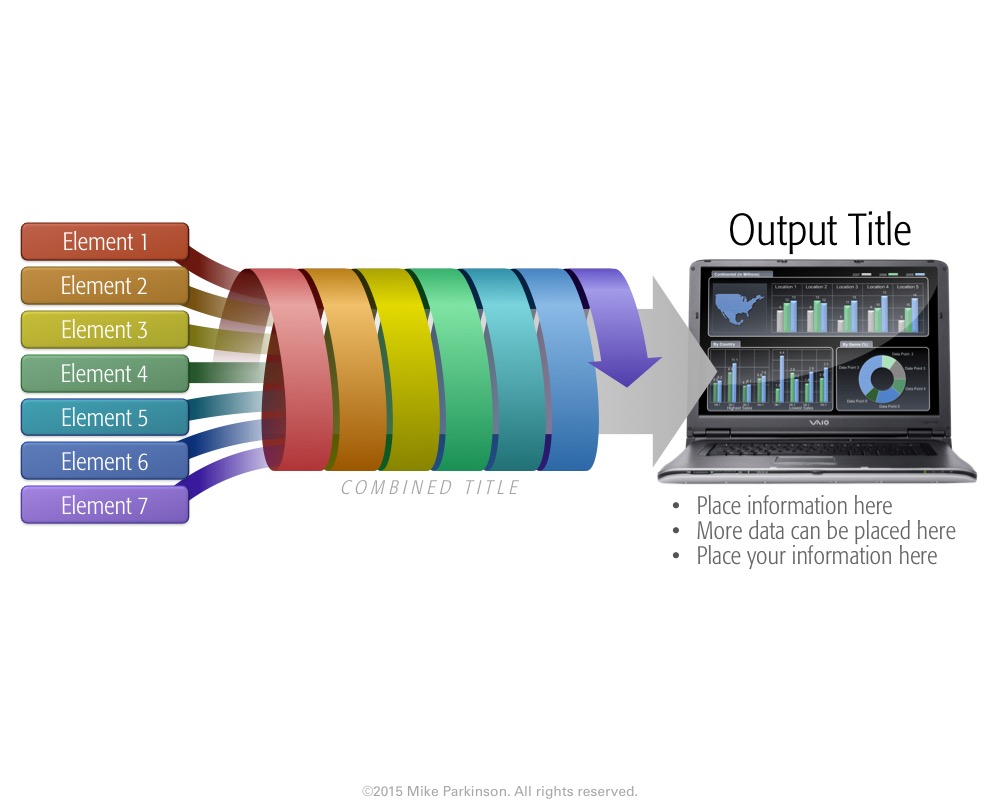
Use this Funnel Graphic as a metaphor showing the passing of elements through a conduit (the funnel) resulting in the…
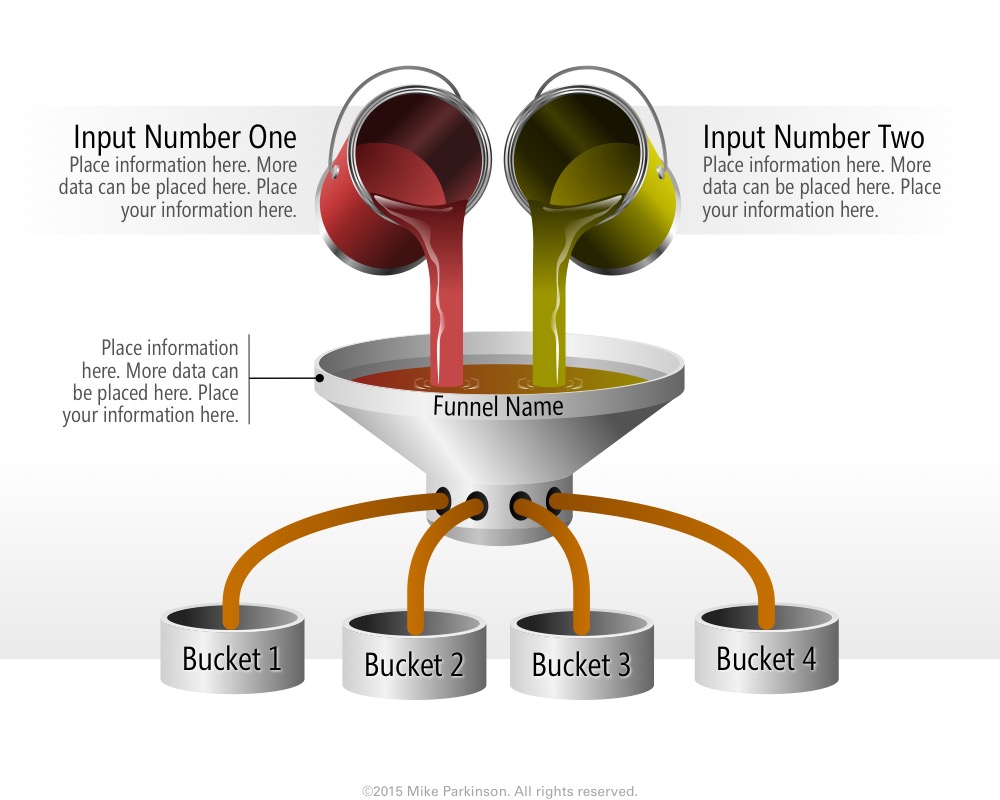
Use this Funnel Graphic as a metaphor showing the passing of elements through a conduit (the funnel) resulting in the…
Use this Funnel Graphic as a metaphor showing the passing of elements through a conduit (the funnel) resulting in the…
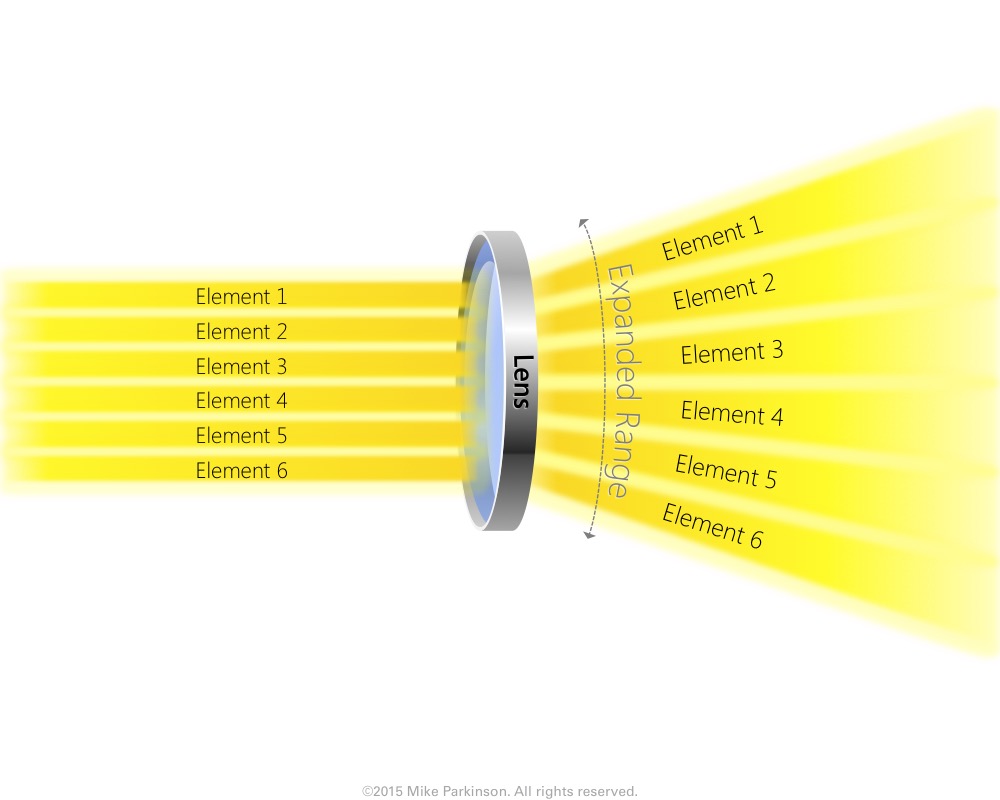
Use this Funnel Graphic as a metaphor showing the passing of elements through a conduit (the funnel) resulting in the…