We're looking forward to speaking at CreativePro Week, the essential how-to conference for anyone that…

We are always adding to our Build-a-Graphic library. We want our users to discover unique ways to visually communicate their ideas.
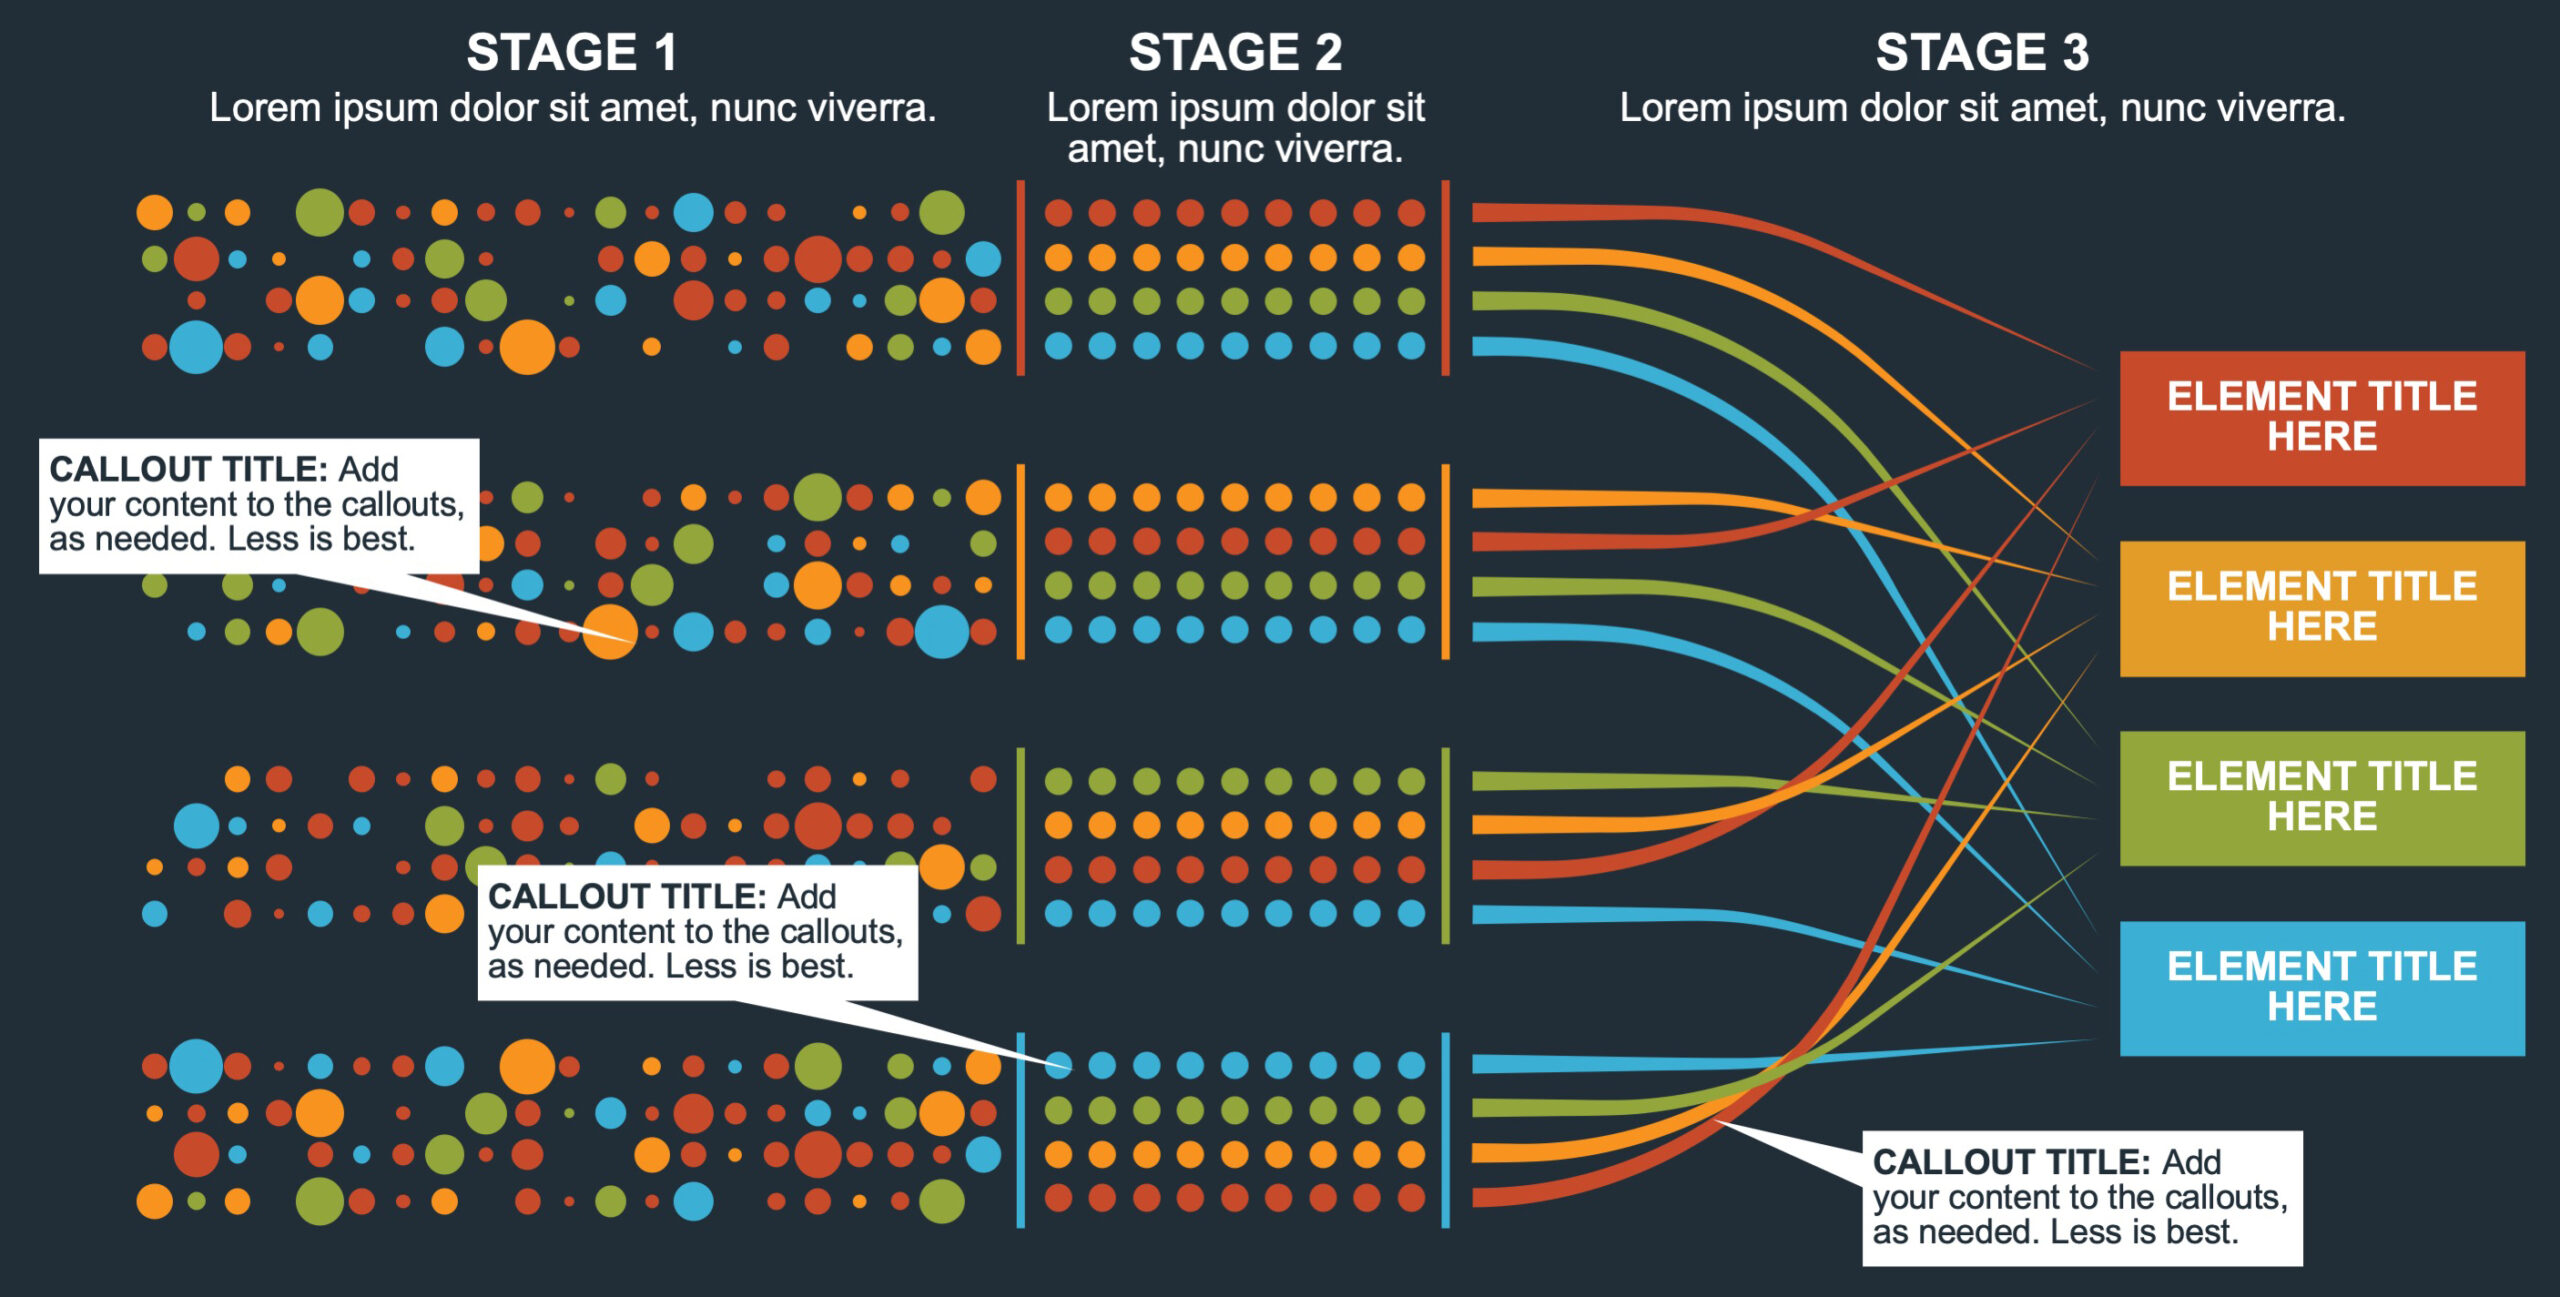
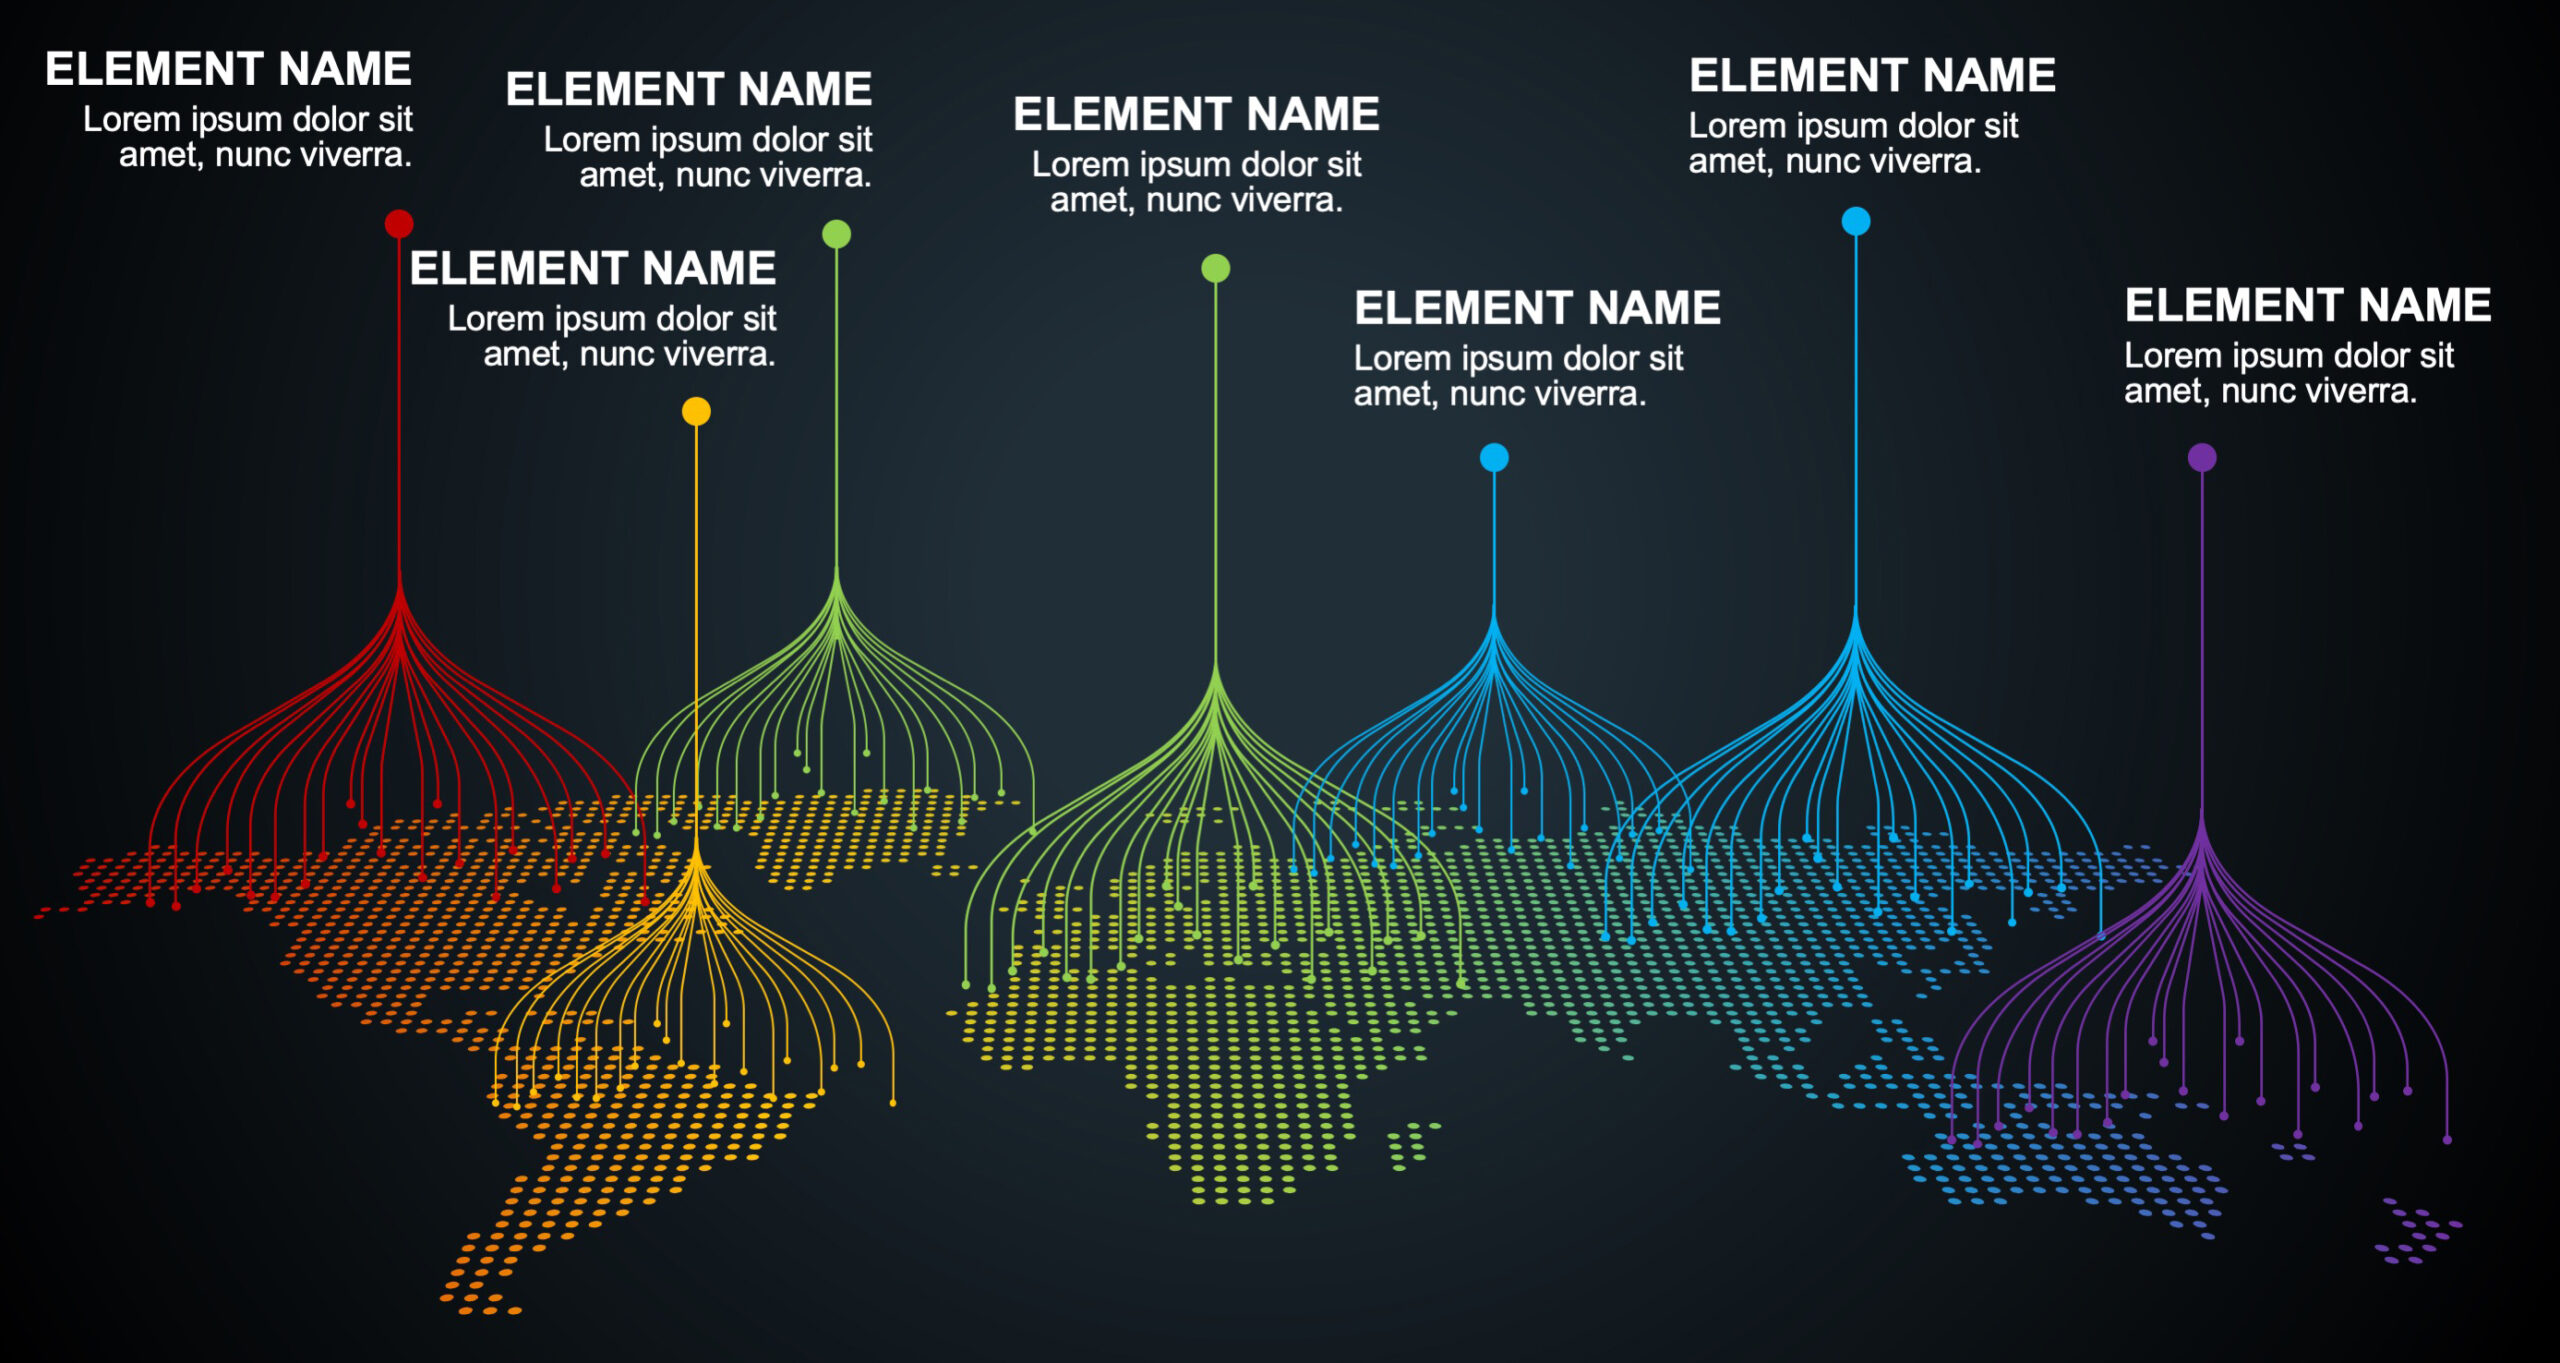
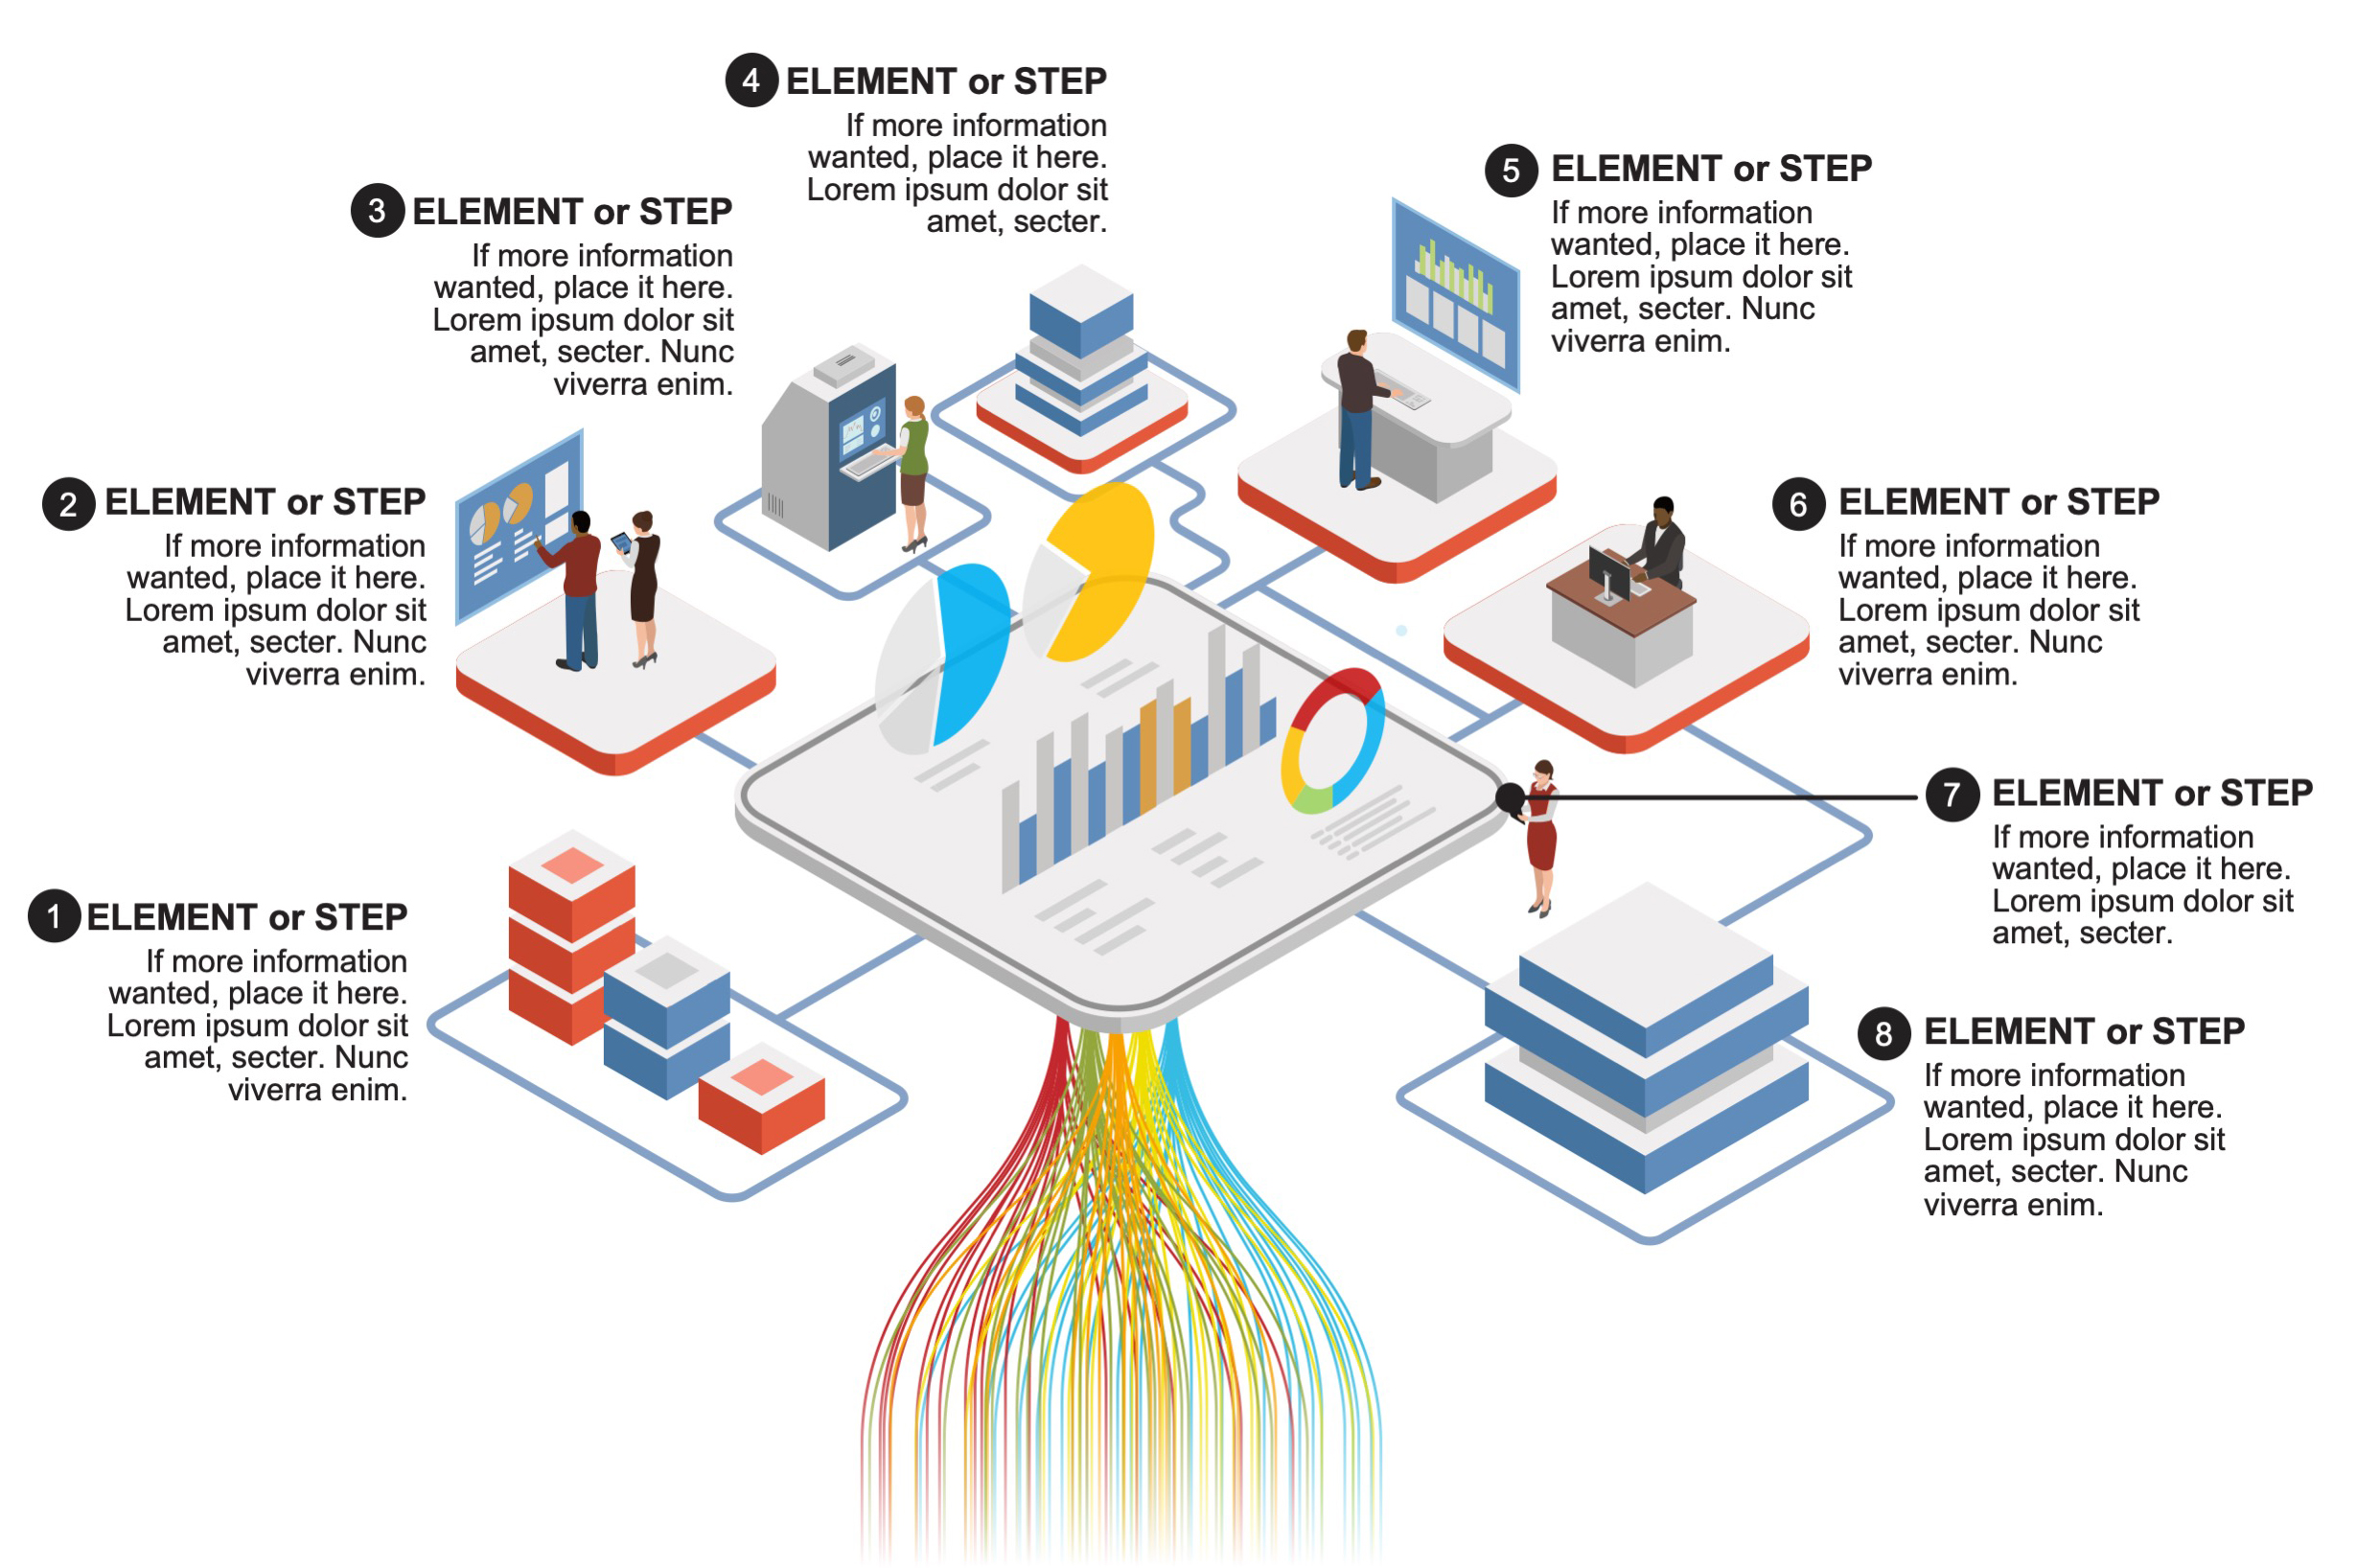
This month we added new graphic collections for our Build-a-Graphic subscribers. Our July favorite is our Big Data graphics.
How do you show how your team analyzes megabytes, gigabytes, or even terabytes of data? Check out these samples below from our Big Data Collection for Build-a-Graphic. All graphics are vector based and fully editable in MS PowerPoint. Plus, they’ll help you distill a complex concept into a visual your audience will better understand and remember.
Want to access more big data graphics and 1,000s of other professional, editable graphics? Download our Build-a-Graphic add-in and quickly create better presentations and graphics.
Related Posts