DNA Graphic 2
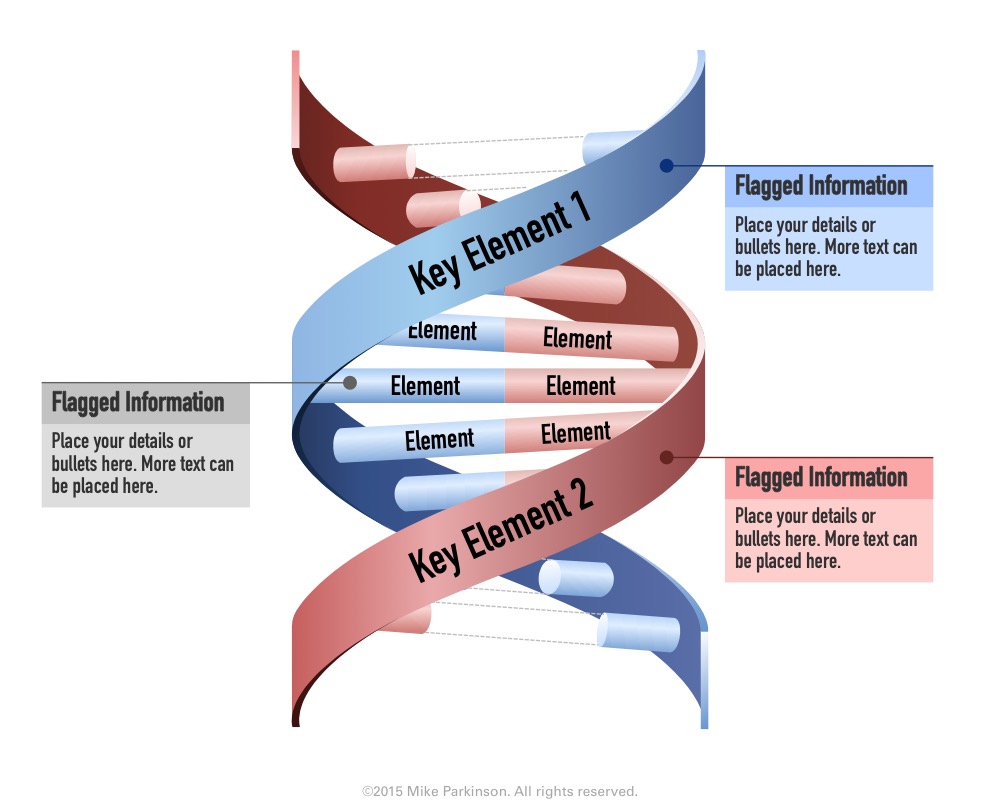
Use this DNA Graphic to illustrate the synergy of multiple actions, concepts, or entities. Together they combine to create a…

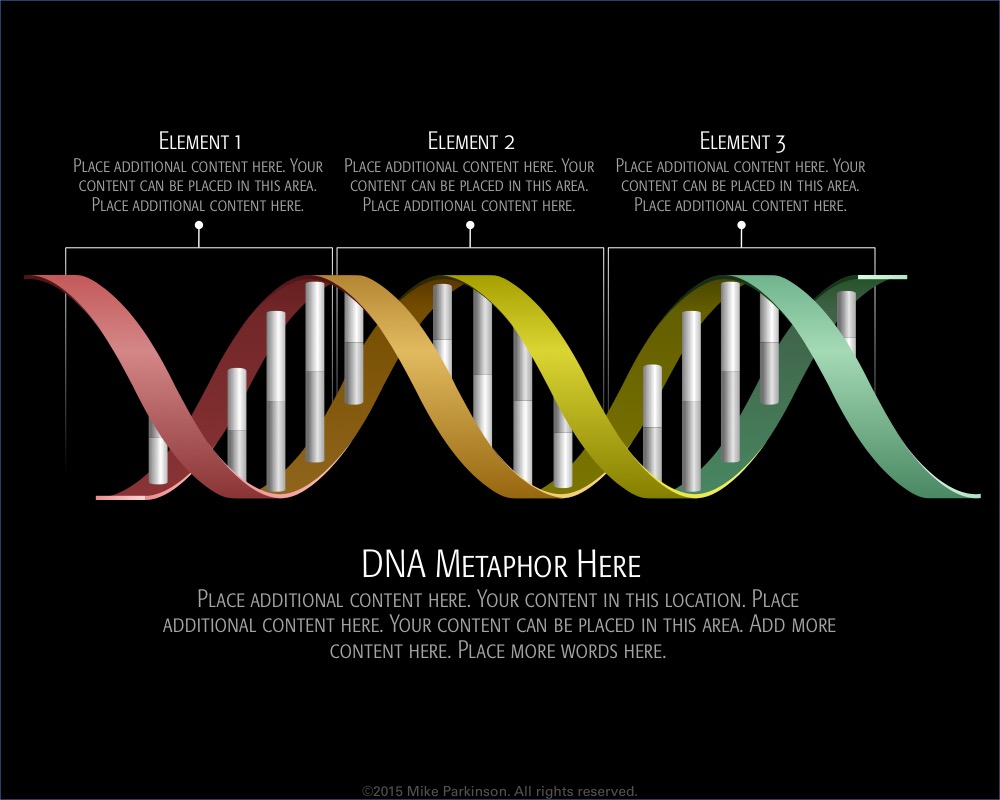
Use this DNA Graphic to illustrate the synergy of multiple actions, concepts, or entities. Together they combine to create a…
Use this DNA Graphic to illustrate the synergy of multiple actions, concepts, or entities. Together they combine to create a…
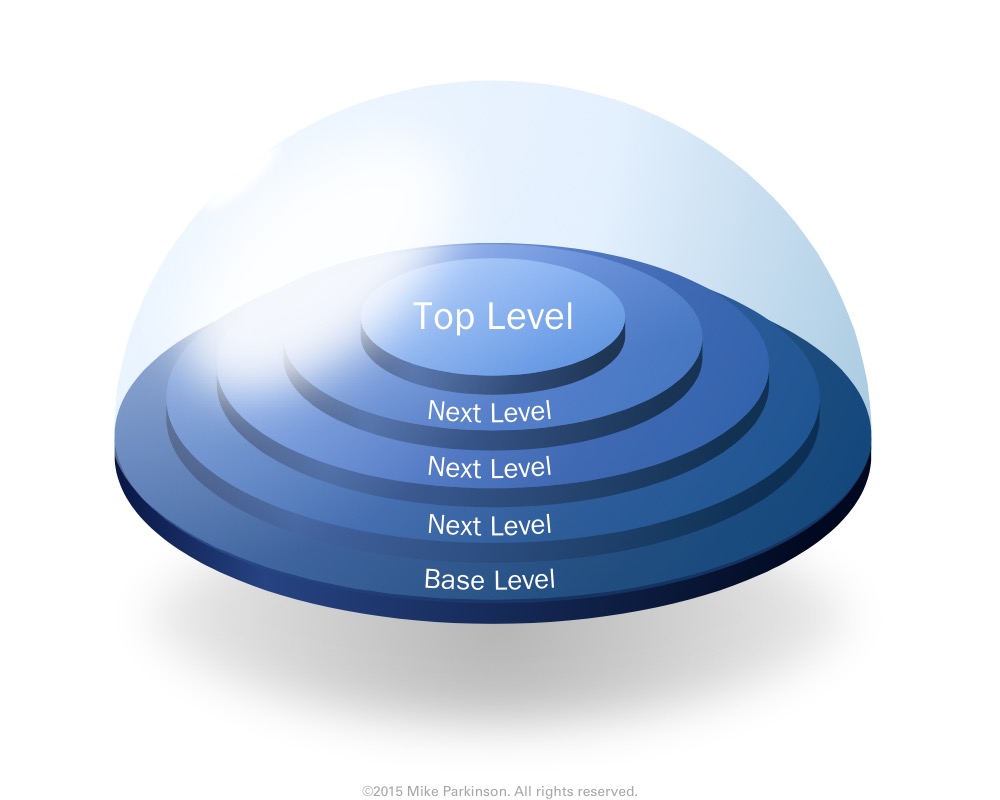
Use this Dome Graphic to show containment, protection, or illustrate and area of influence.
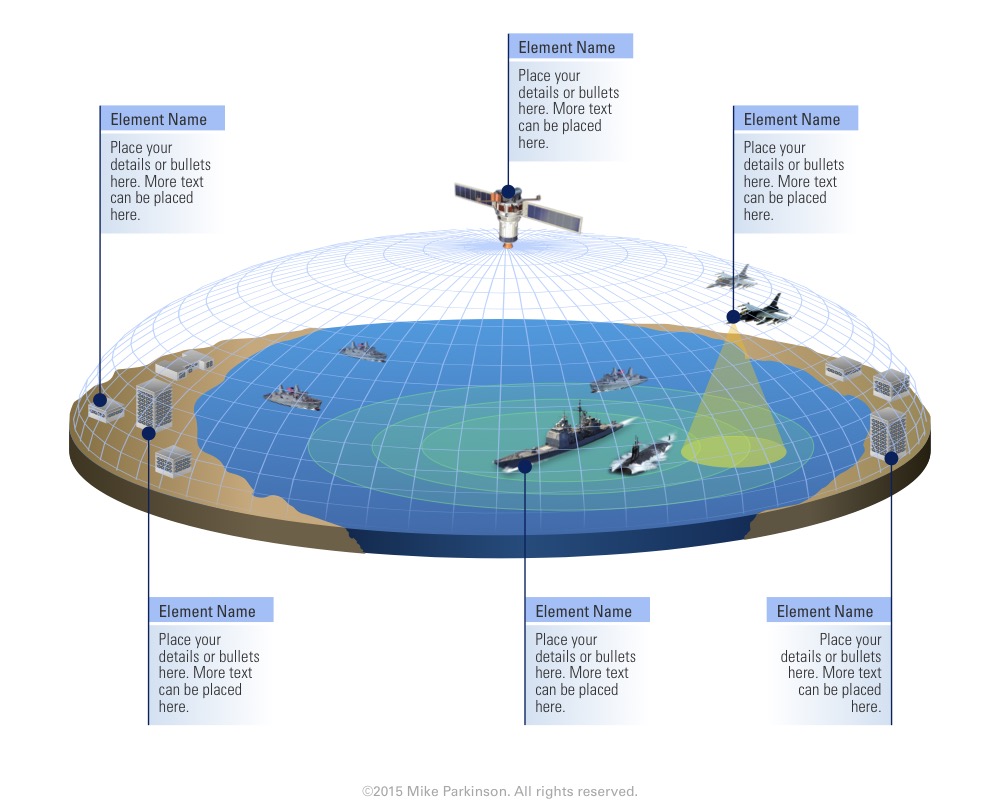
Use this Dome Graphic to show containment, protection, or illustrate and area of influence.

Use this Dome Graphic to show containment, protection, or illustrate and area of influence.
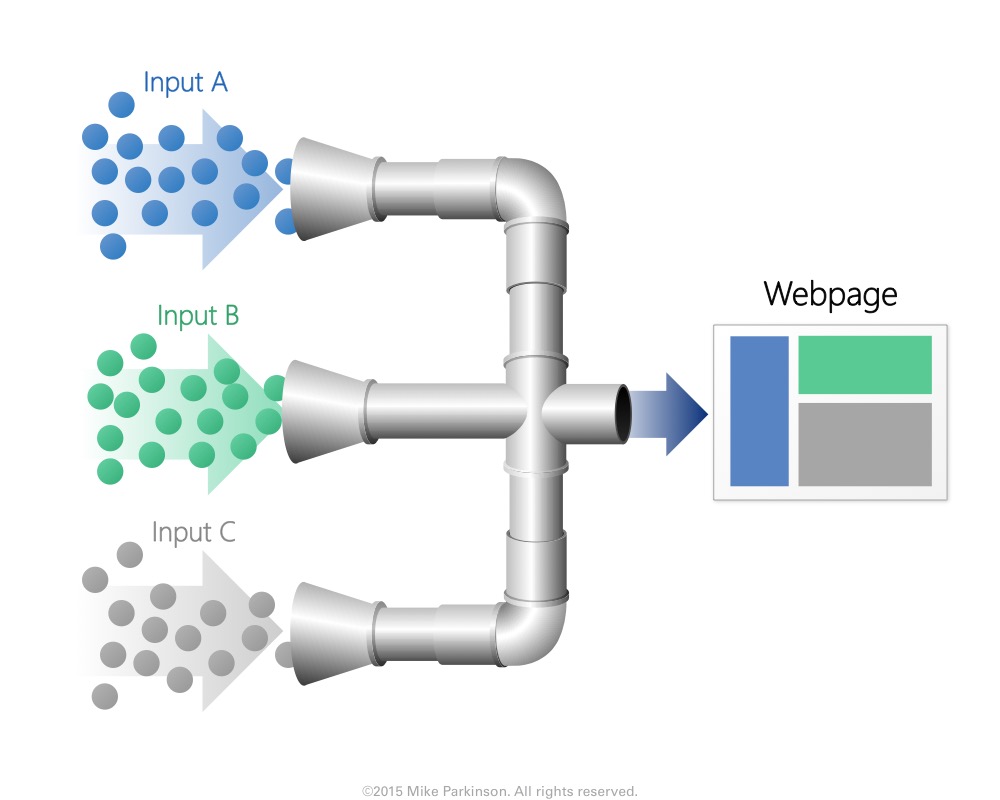
Use this Pipe Graphic to show a designed, structured process and the isolated linear flow of elements.
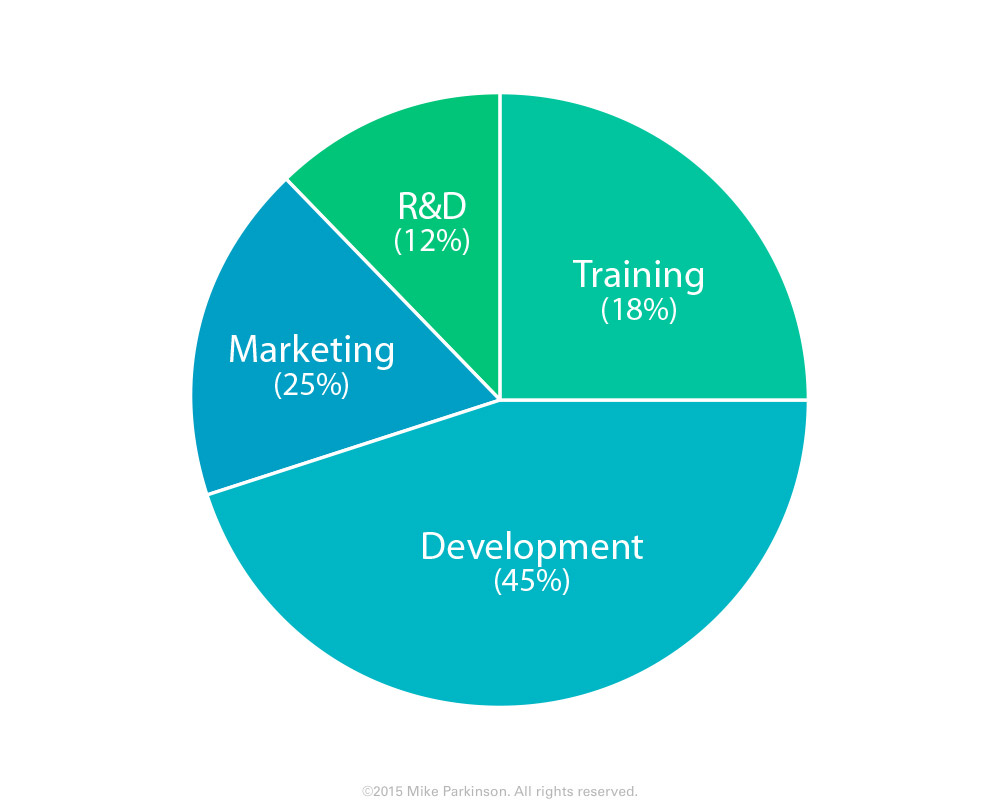
Use this Pie Chart to show percentages relative to the whole.
Use this Pie Chart to show percentages relative to the whole.
Use this Pie Chart to show percentages relative to the whole.

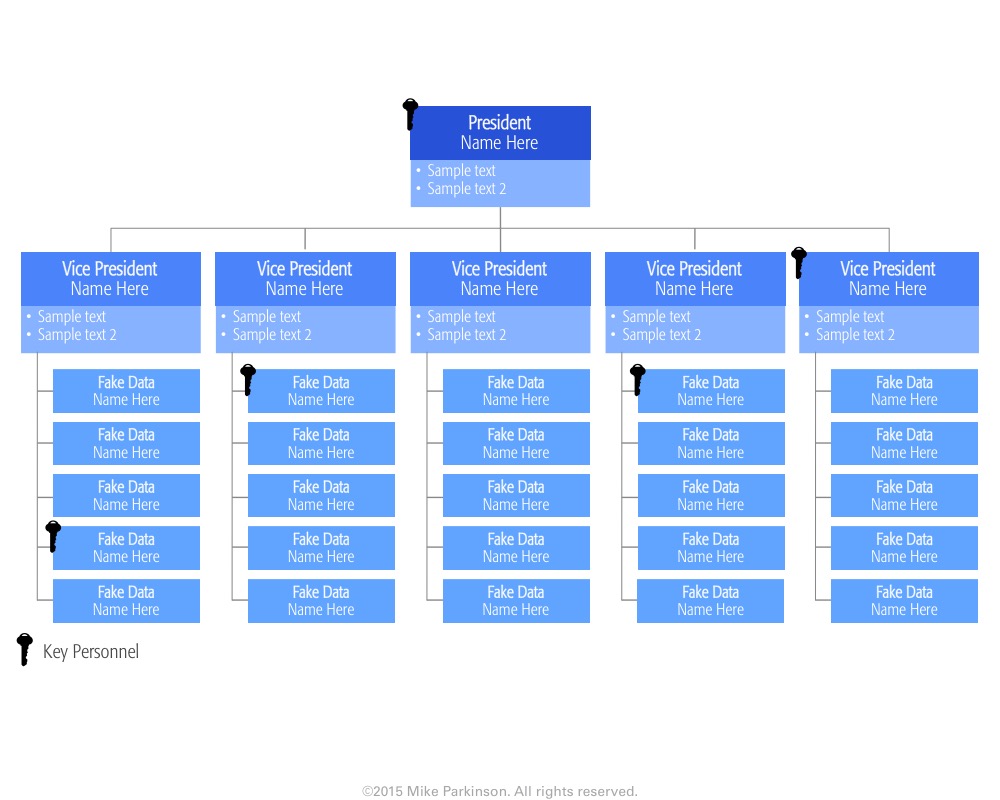
Use this Organizational Chart to depict hierarchy, arrangement, structure, and/or relationship of a group of elements (e.g., an organization and…
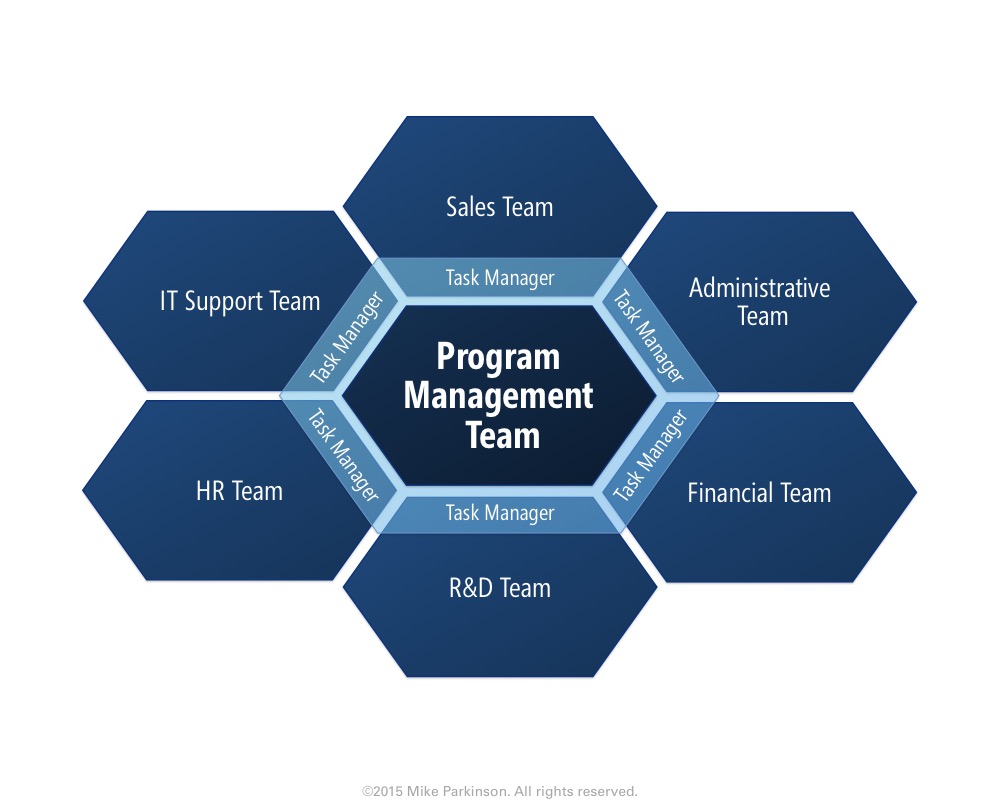
Use this Organizational Chart to depict hierarchy, arrangement, structure, and/or relationship of a group of elements (e.g., an organization and…
Use this Organizational Chart to depict hierarchy, arrangement, structure, and/or relationship of a group of elements (e.g., an organization and…