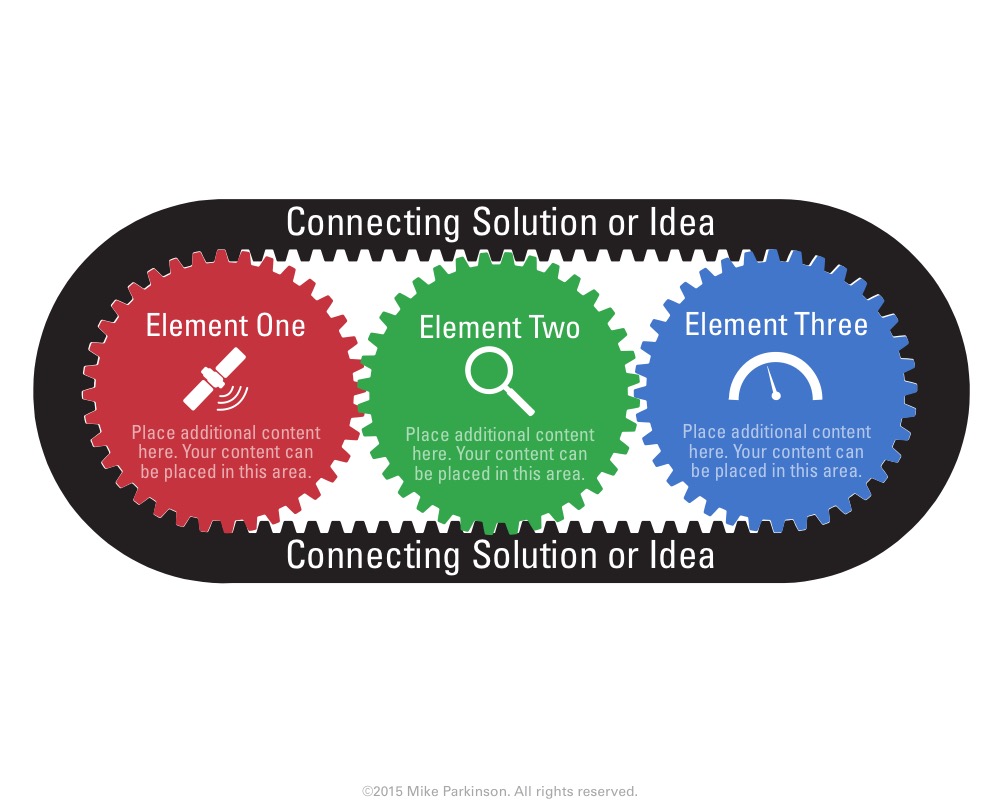
Gear Graphic 2
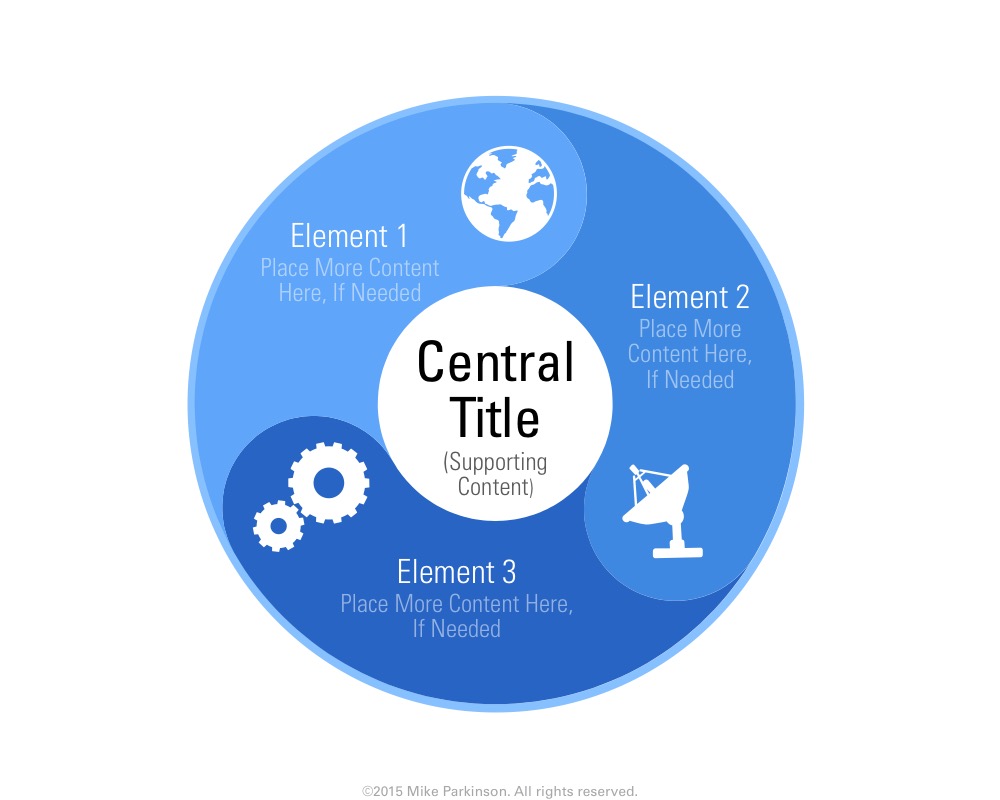
Use this Gear Graphic as to show how parts work together as a whole and a visual metaphor for process…

Use this Gear Graphic as to show how parts work together as a whole and a visual metaphor for process…
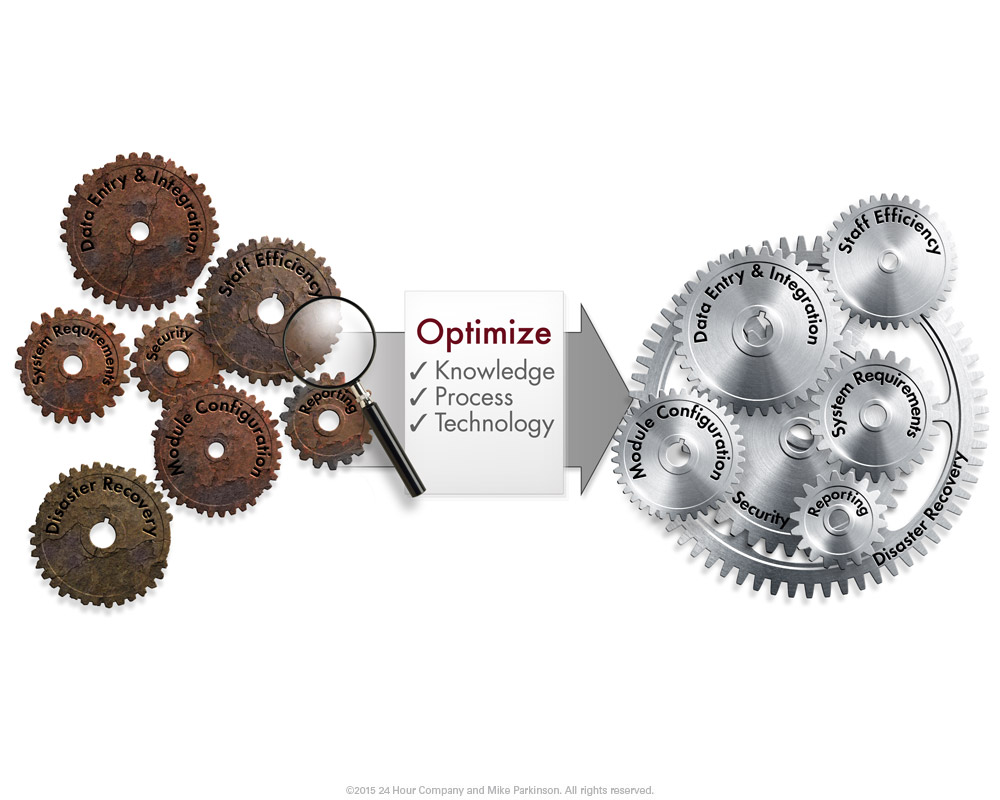
Use this Gear Graphic as to show how parts work together as a whole and a visual metaphor for process…
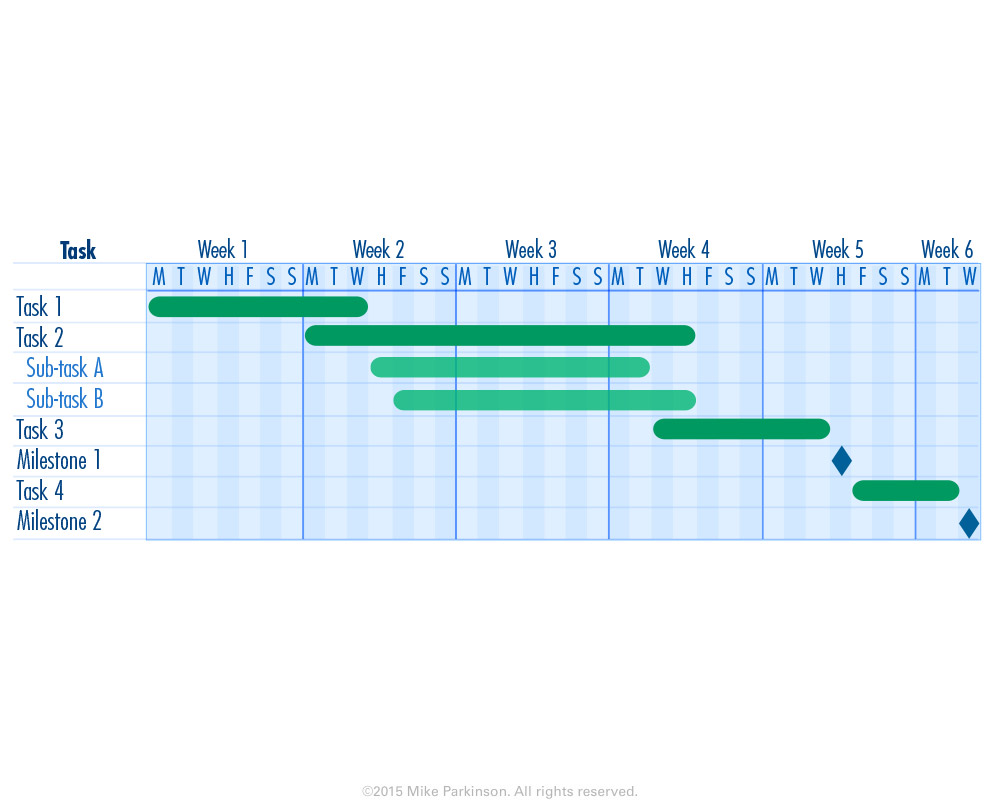
Use this Gantt Chart to communicate schedule and activity for tracking, planning, review purposes. (This chart is NOT data driven.)
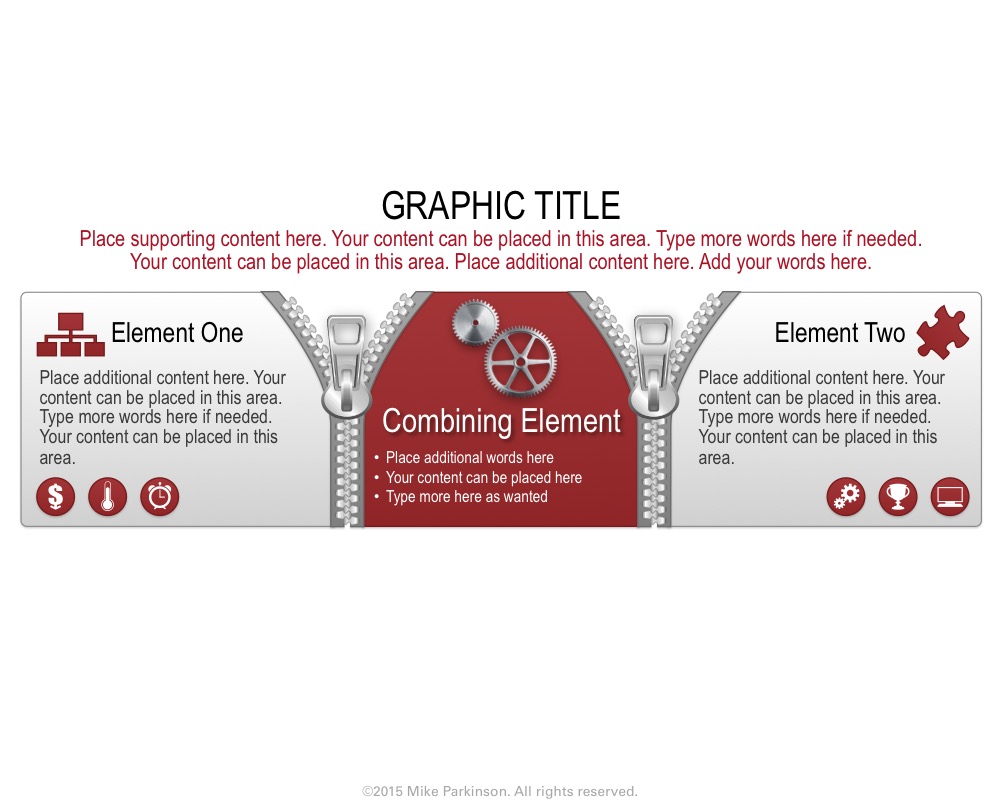
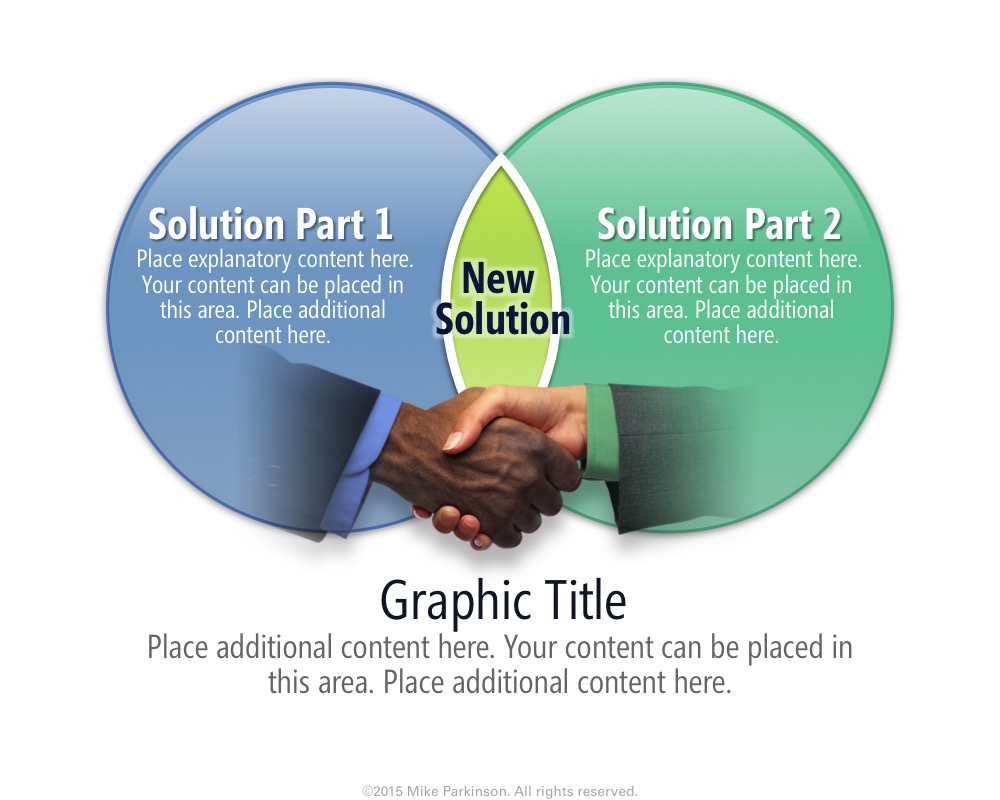
Use this Zipper Graphic to show divisions uniting or elements interlocking.
Use this Venn Diagram to show the relationship and/or synergy of disparate elements through the overlap of those elements.

Use this Venn Diagram to show the relationship and/or synergy of disparate elements through the overlap of those elements.
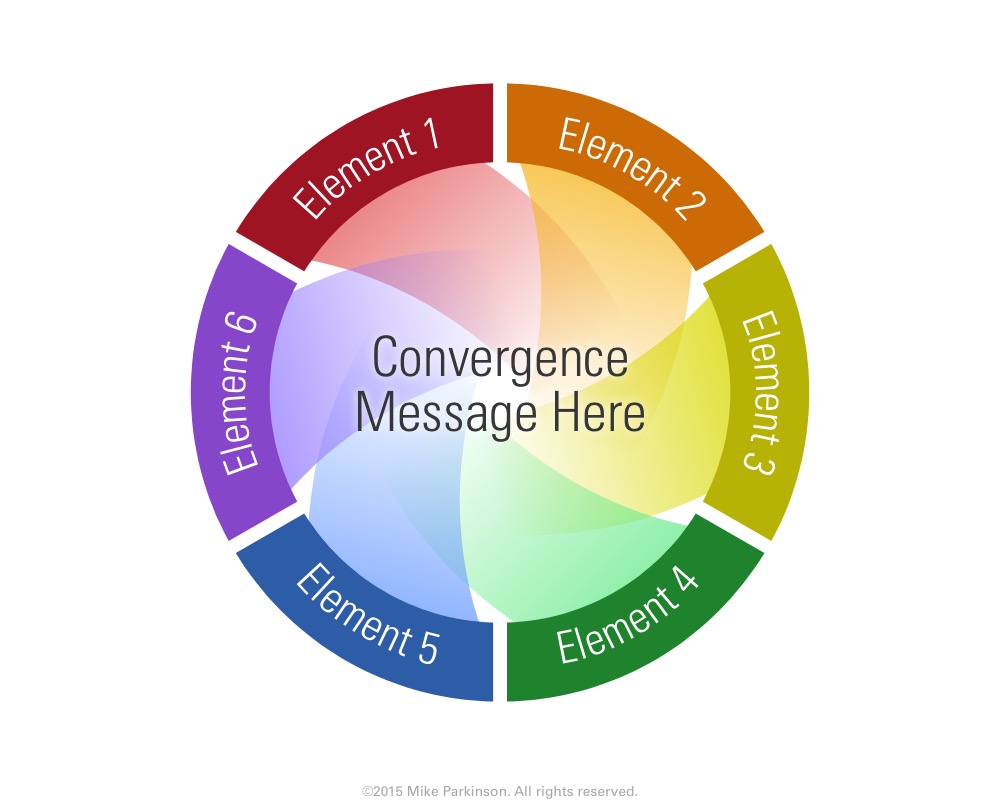
Use this Venn Diagram to show the relationship and/or synergy of disparate elements through the overlap of those elements.
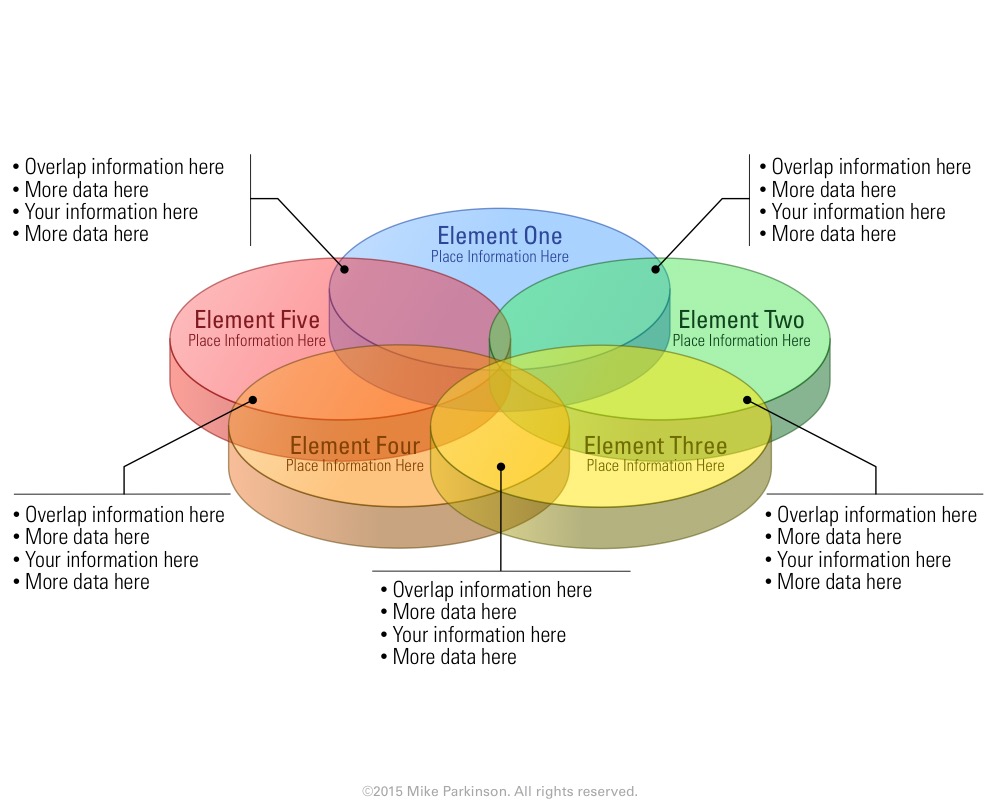
Use this Venn Diagram to show the relationship and/or synergy of disparate elements through the overlap of those elements.
Use this Venn Diagram to show the relationship and/or synergy of disparate elements through the overlap of those elements.

Use this Venn Diagram to show the relationship and/or synergy of disparate elements through the overlap of those elements.
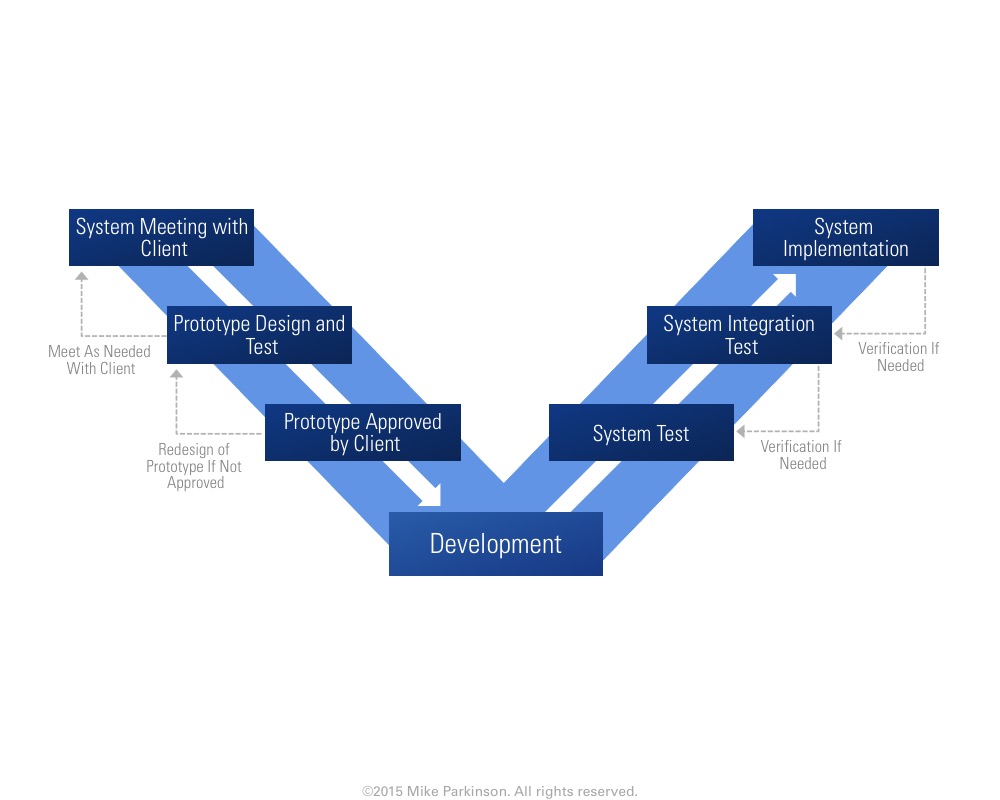
Use this Vee Diagram to illustrate relationships, and a process for validation and verification. (Also called an IV&V Diagram.)
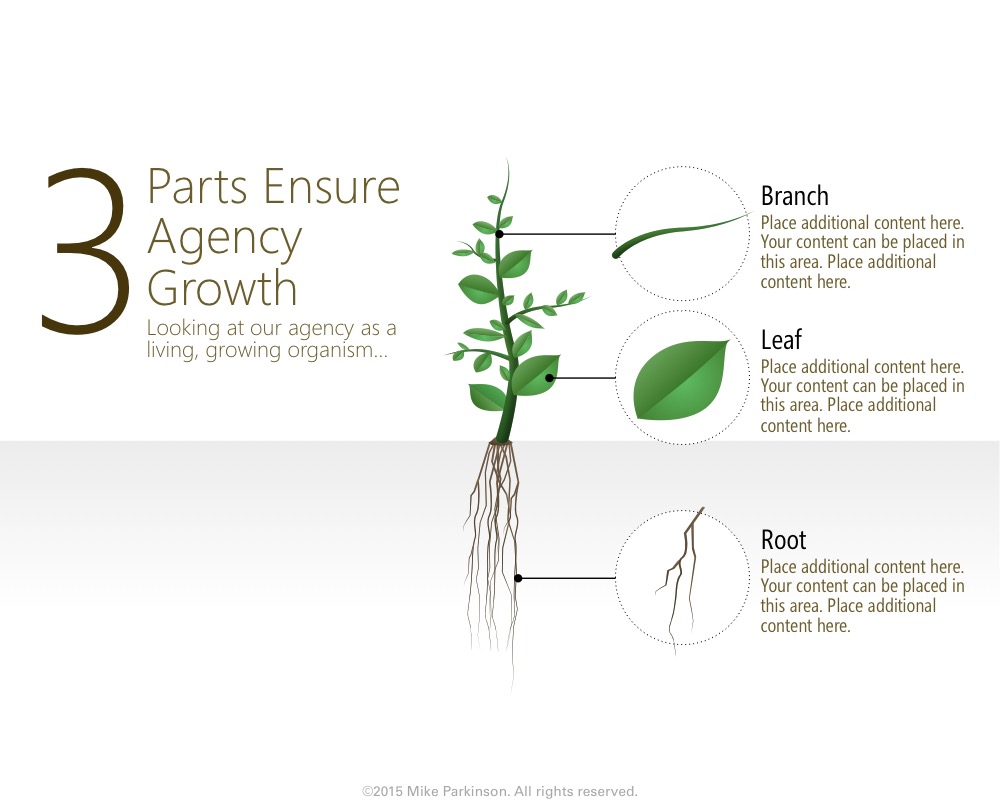
Use this graphic as a branching diagram or visual metaphor depicting categories and groupings of elements to show cause and…