Infographic 3
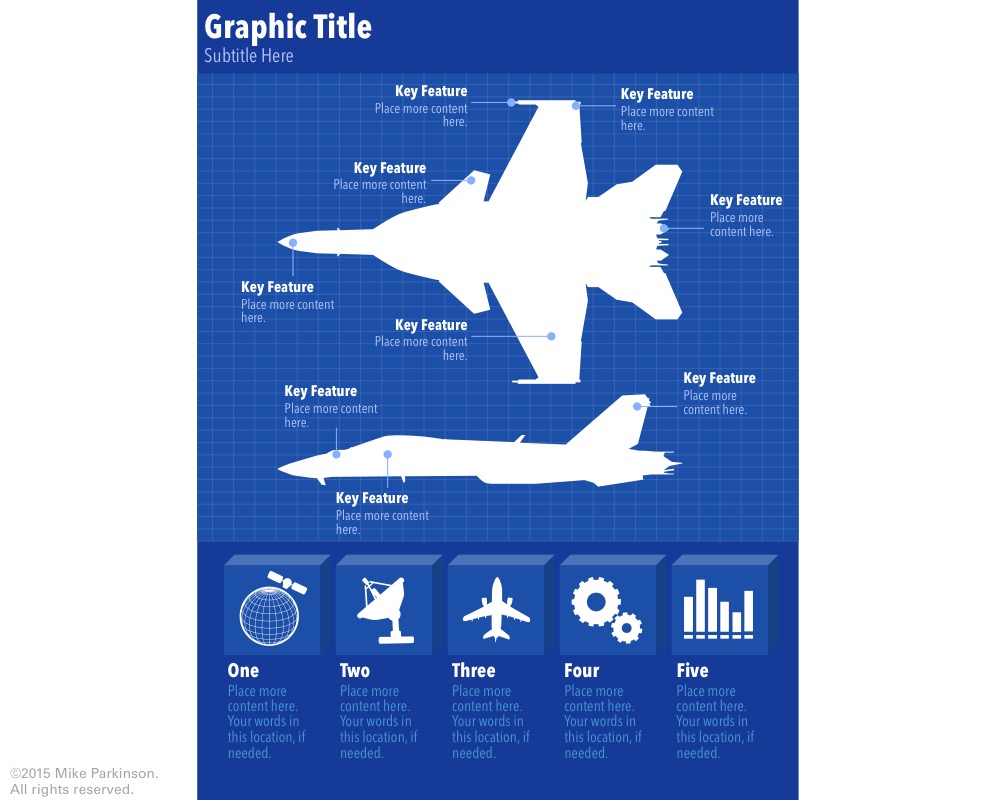
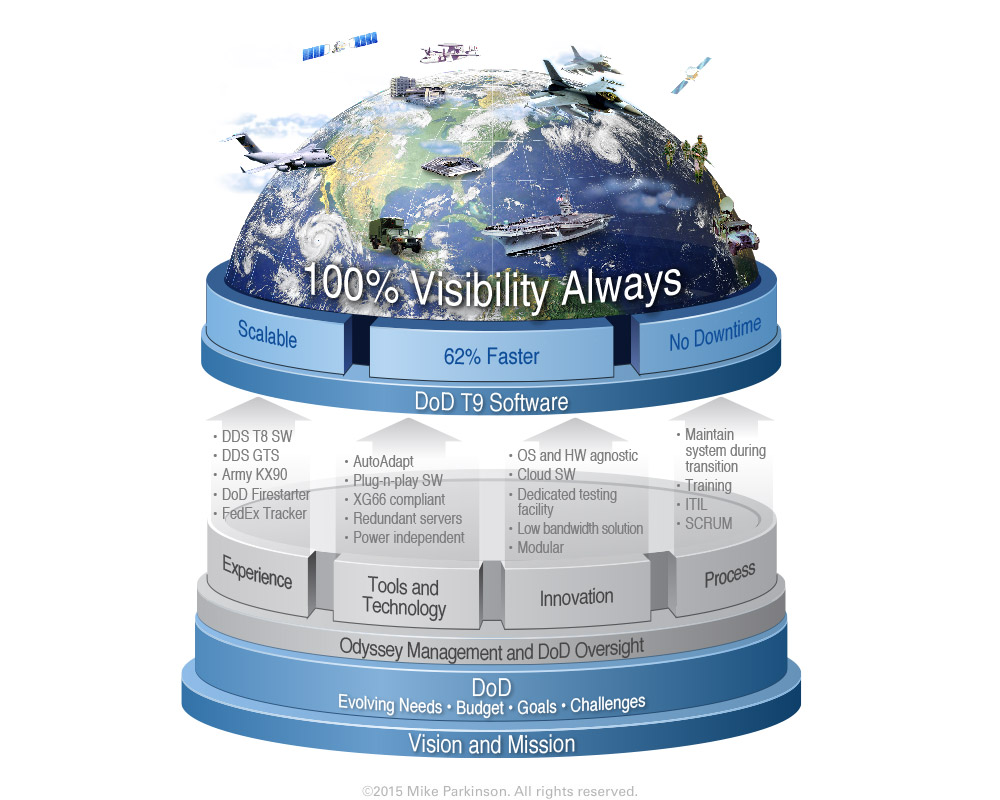
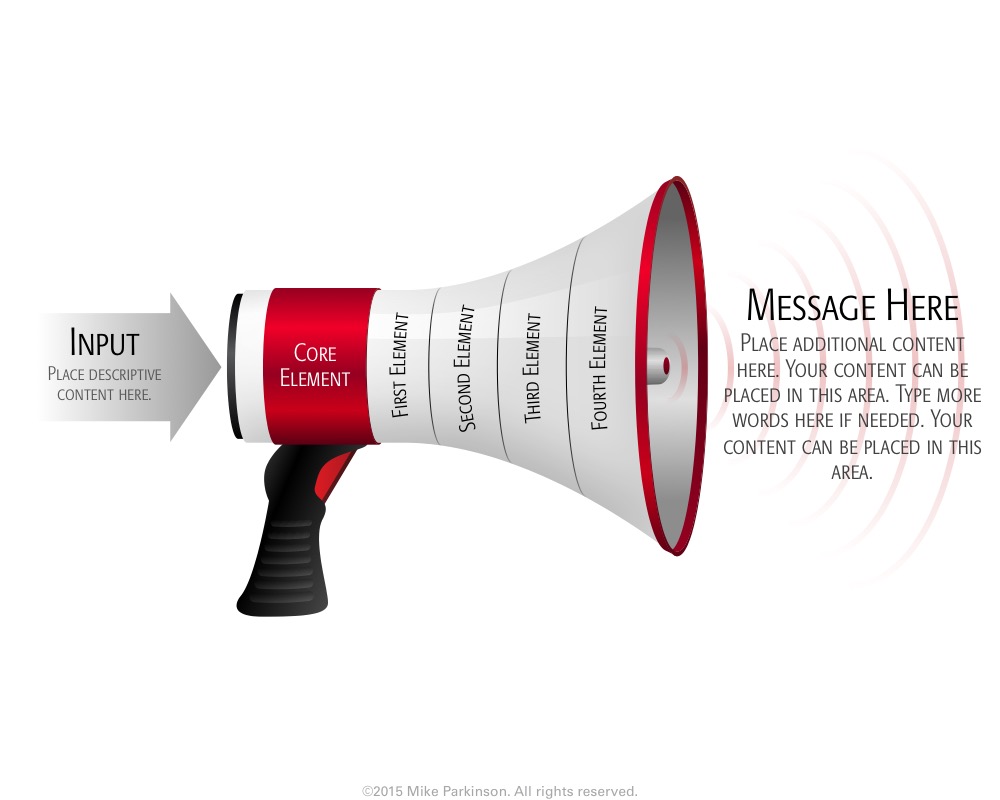
Use this Infographic to showcase interconnected information related to a specific topic.

Use this Infographic to showcase interconnected information related to a specific topic.
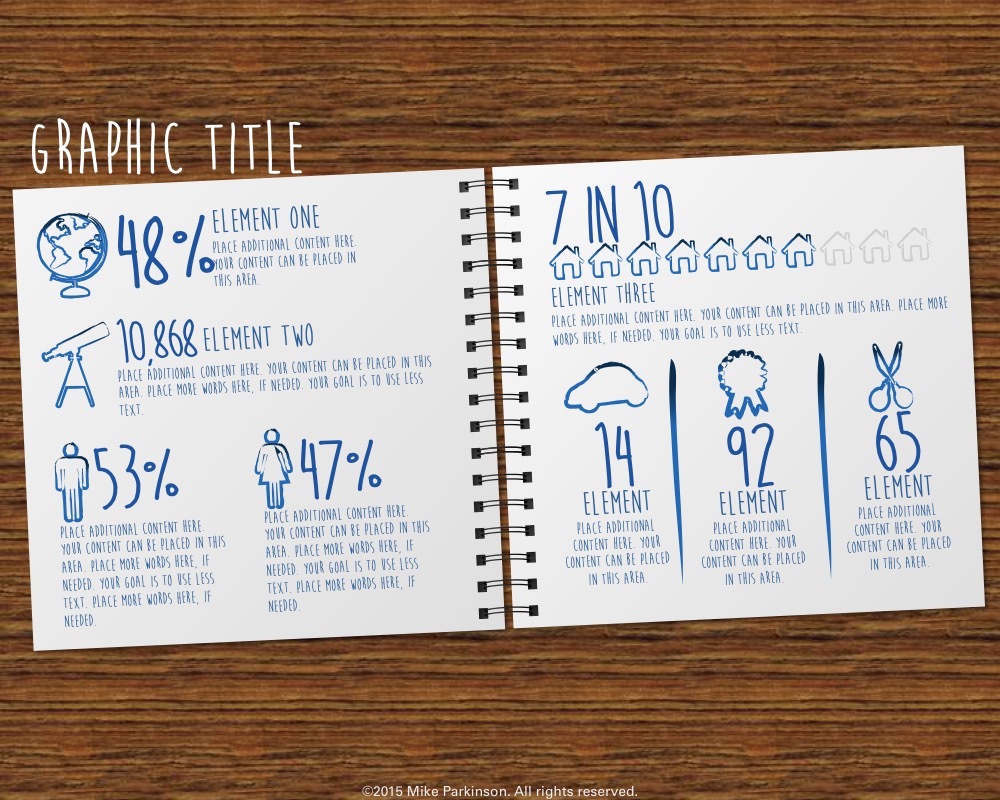
Use this Infographic to showcase interconnected information related to a specific topic.

Use this Infographic to showcase interconnected information related to a specific topic.
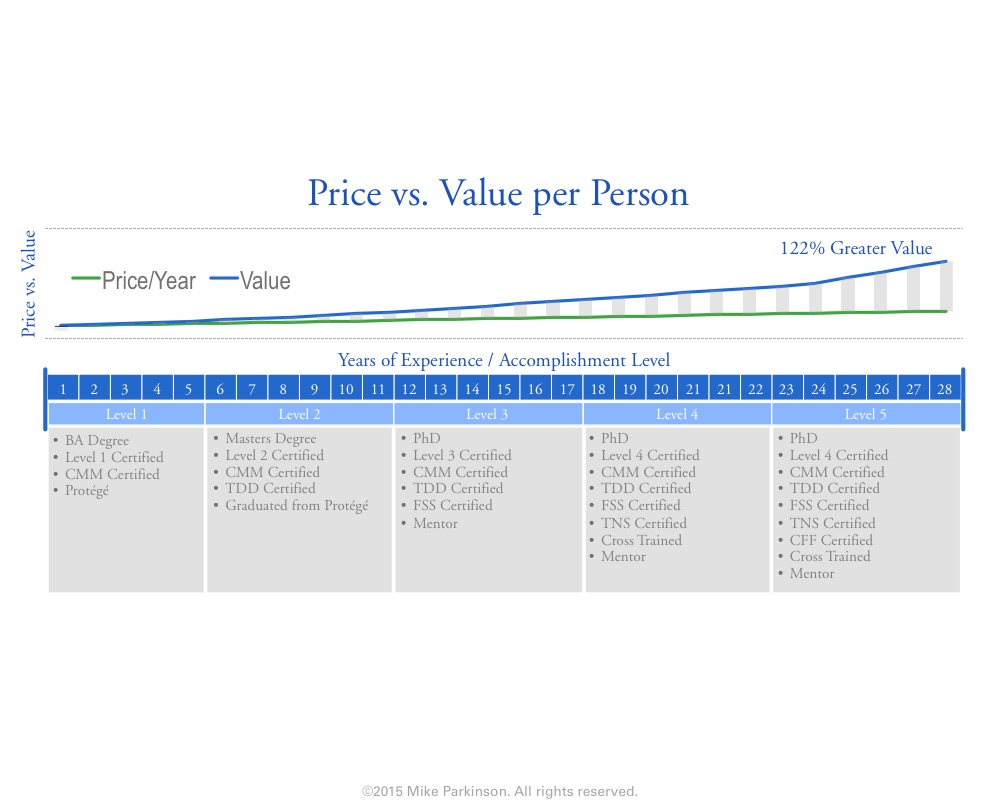
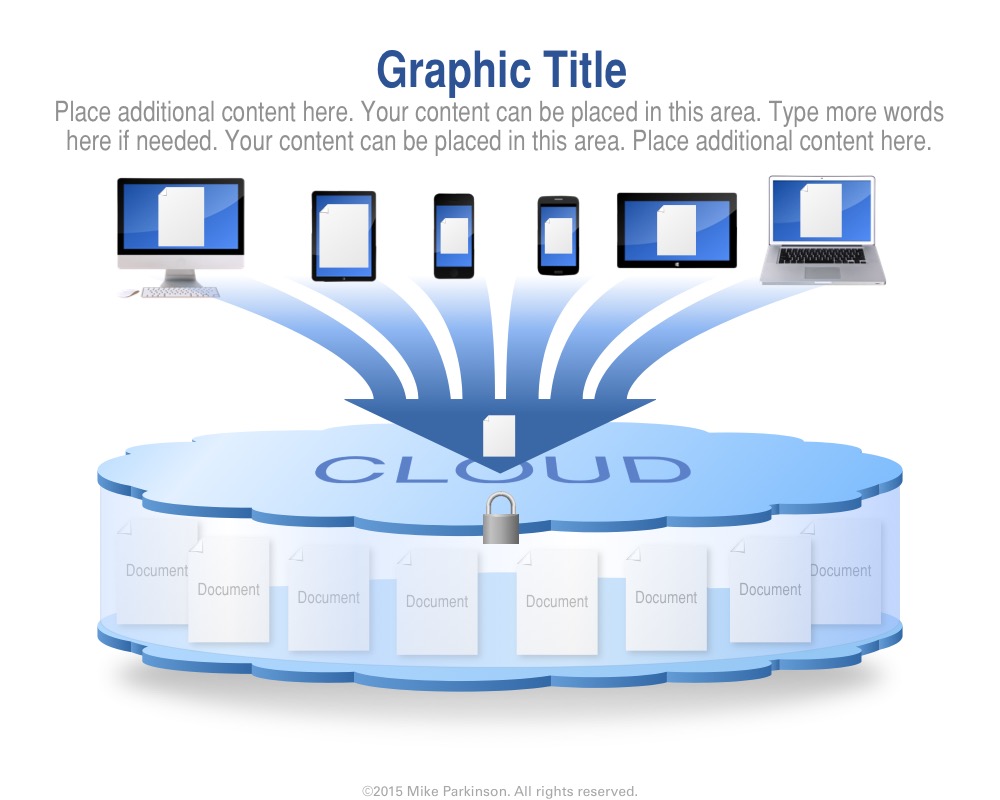
Use this Graph to show amounts, values, and time. This graphic is data driven.

Use this Graph to show amounts, values, and time. This graphic is data driven.
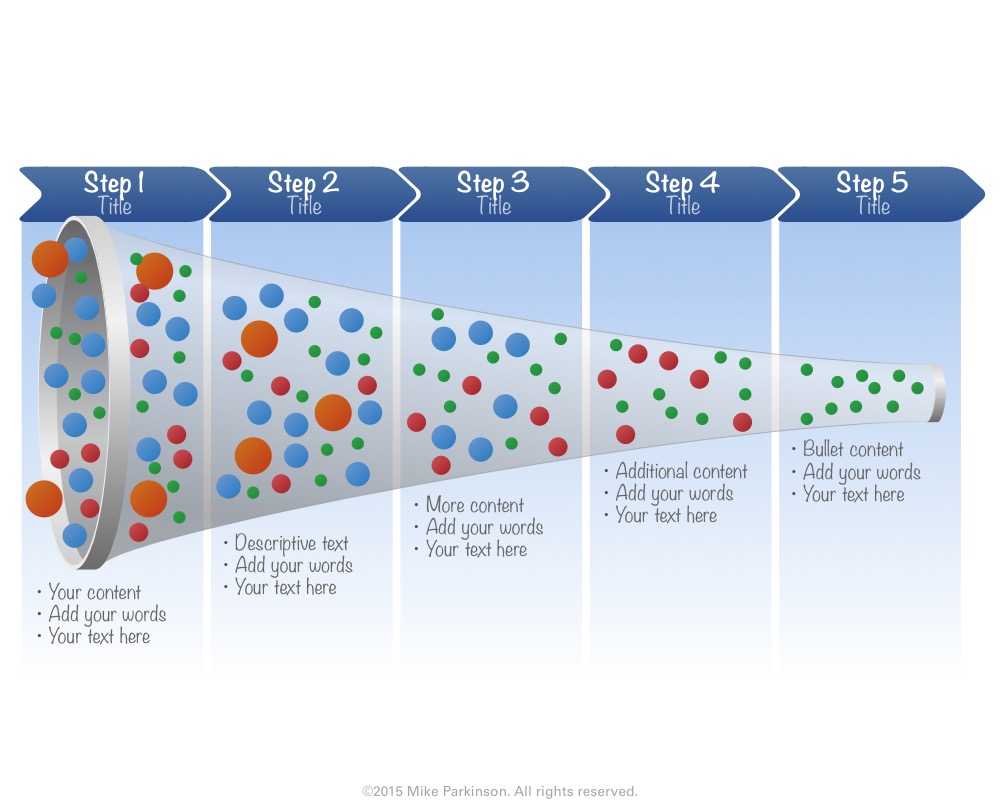
Use these Stacked Diagram parts to create your stacked diagrams.
Use these Stacked Diagram parts to create your stacked diagrams.
Use these Stacked Diagram parts to create your stacked diagrams.
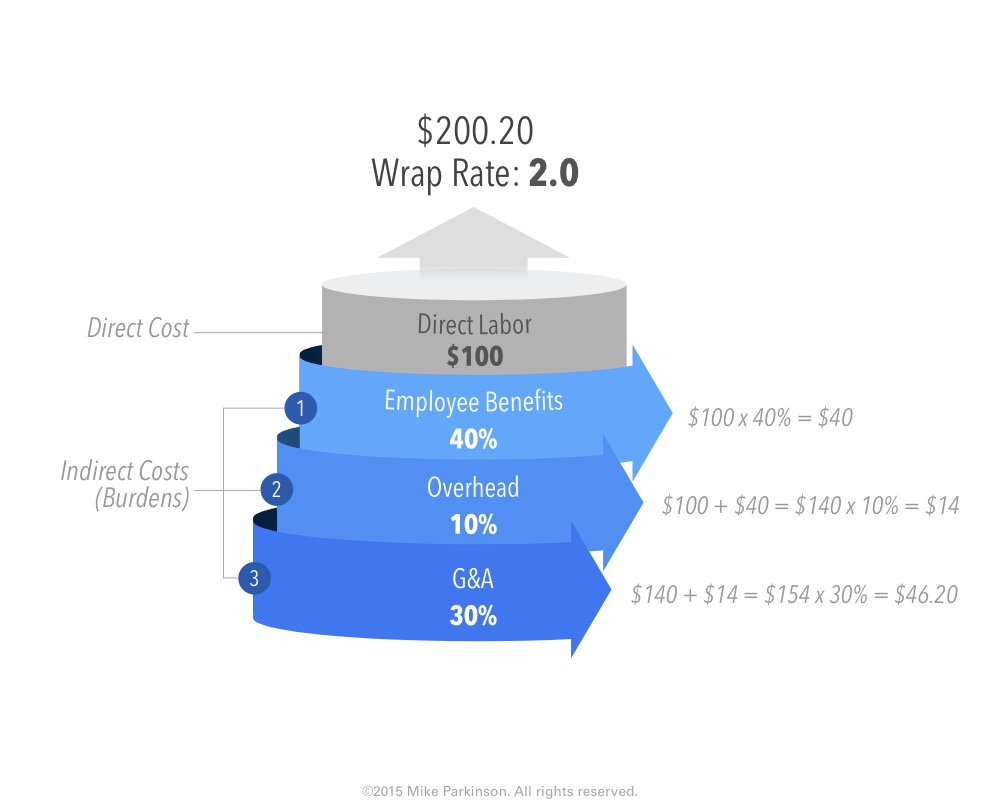
Use this Funnel Graphic as a metaphor showing the passing of elements through a conduit (the funnel) resulting in the…
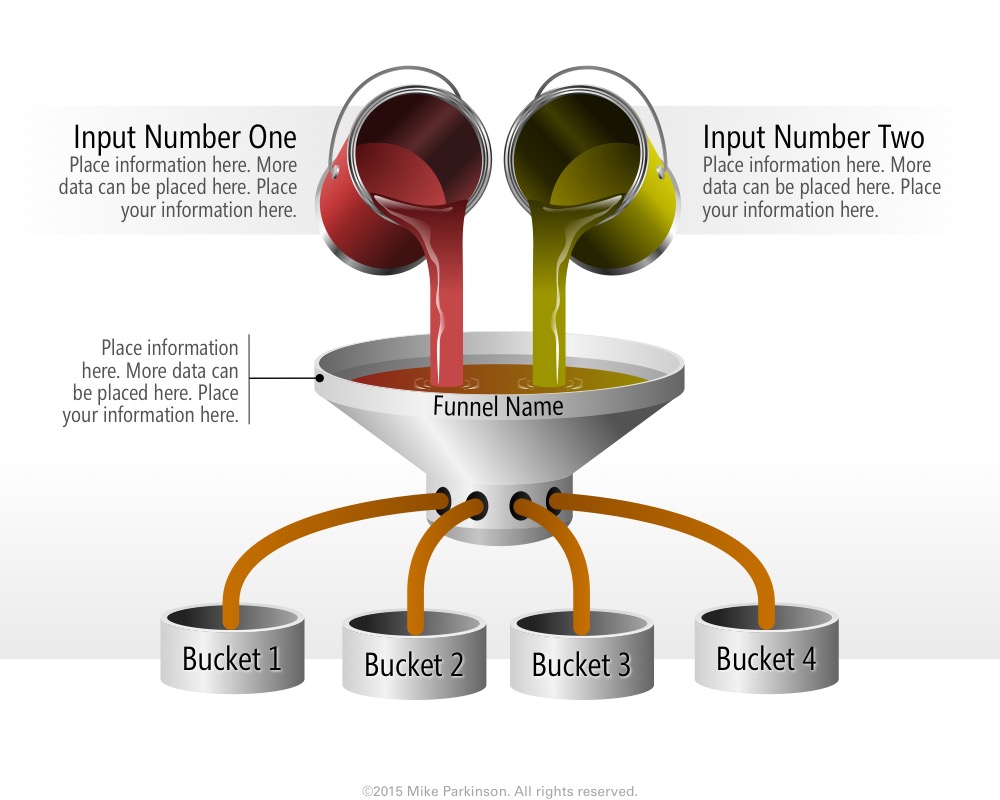
Use this Funnel Graphic as a metaphor showing the passing of elements through a conduit (the funnel) resulting in the…
Use this Funnel Graphic as a metaphor showing the passing of elements through a conduit (the funnel) resulting in the…
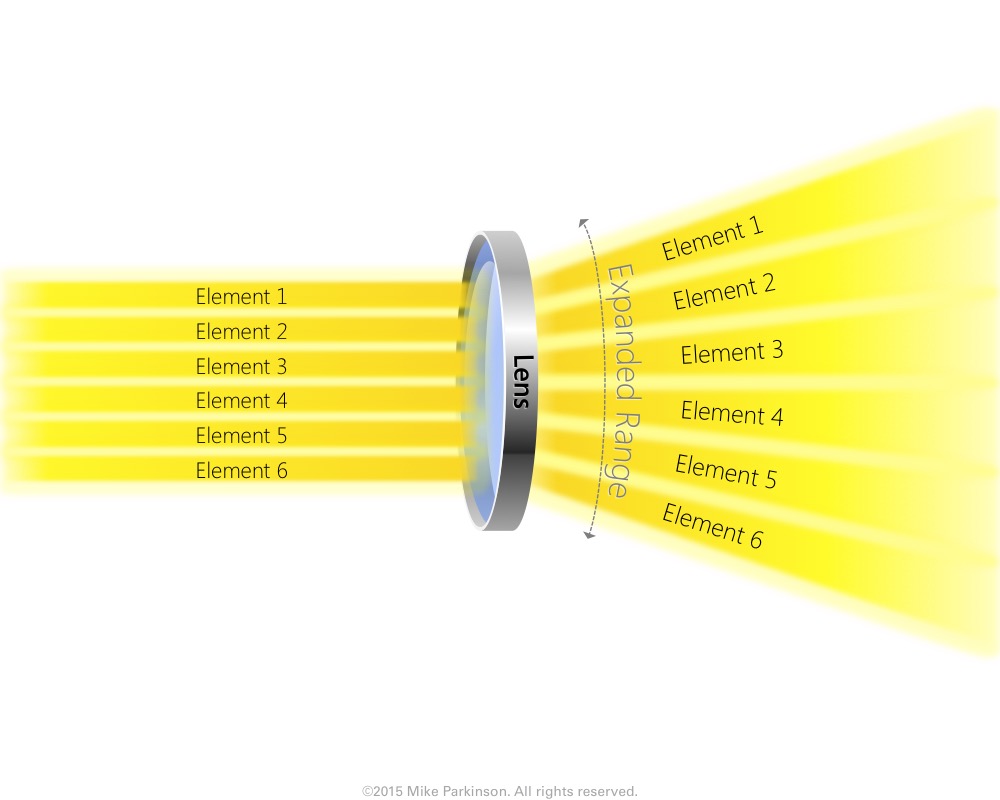
Use this Funnel Graphic as a metaphor showing the passing of elements through a conduit (the funnel) resulting in the…