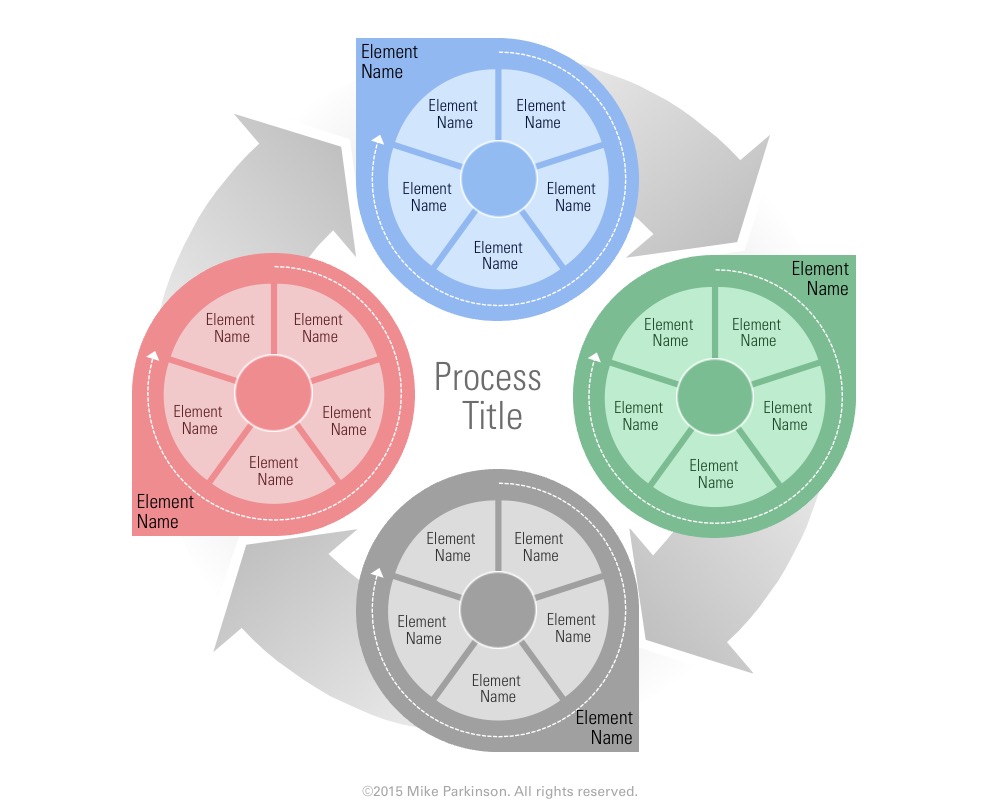
Loop Graphic 4
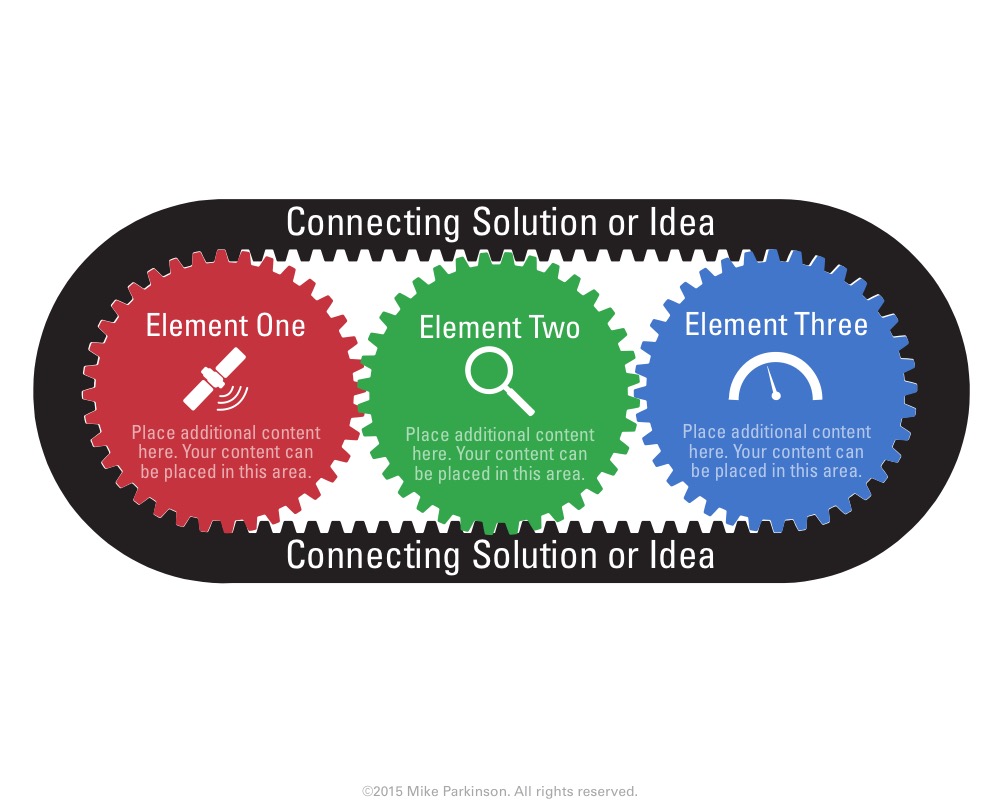
Use this Looping Graphic to show repeatable processes.

Use this Looping Graphic to show repeatable processes.

Use this Looping Graphic to show repeatable processes.
Use this Looping Graphic to show repeatable processes.
Use this Looping Graphic to show repeatable processes.
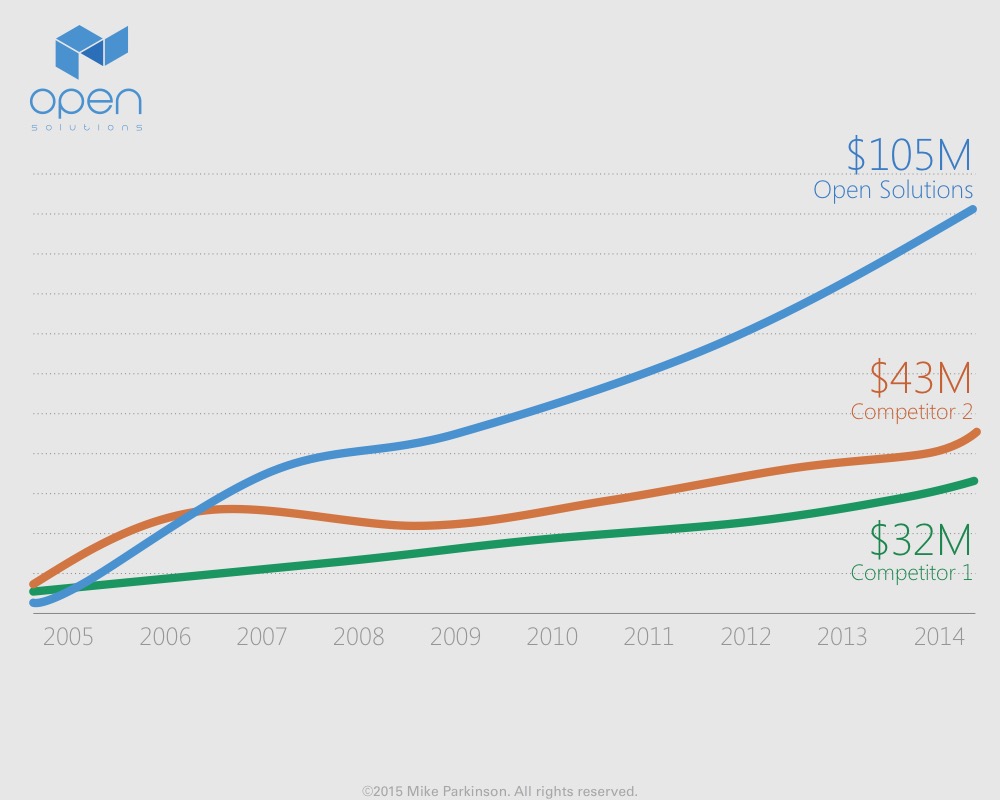
Use this Line Chart shows quantitative data. This graphic is data driven.
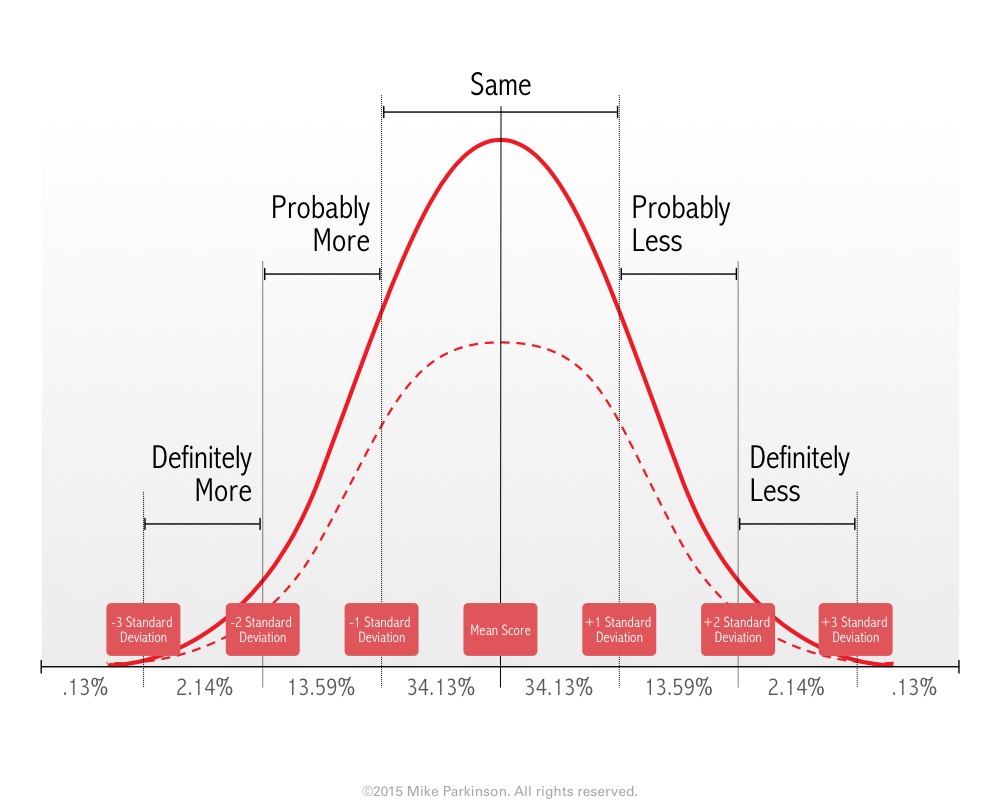
Use this Line Chart (Bell Curve) to show quantitative data. This graphic is data driven.

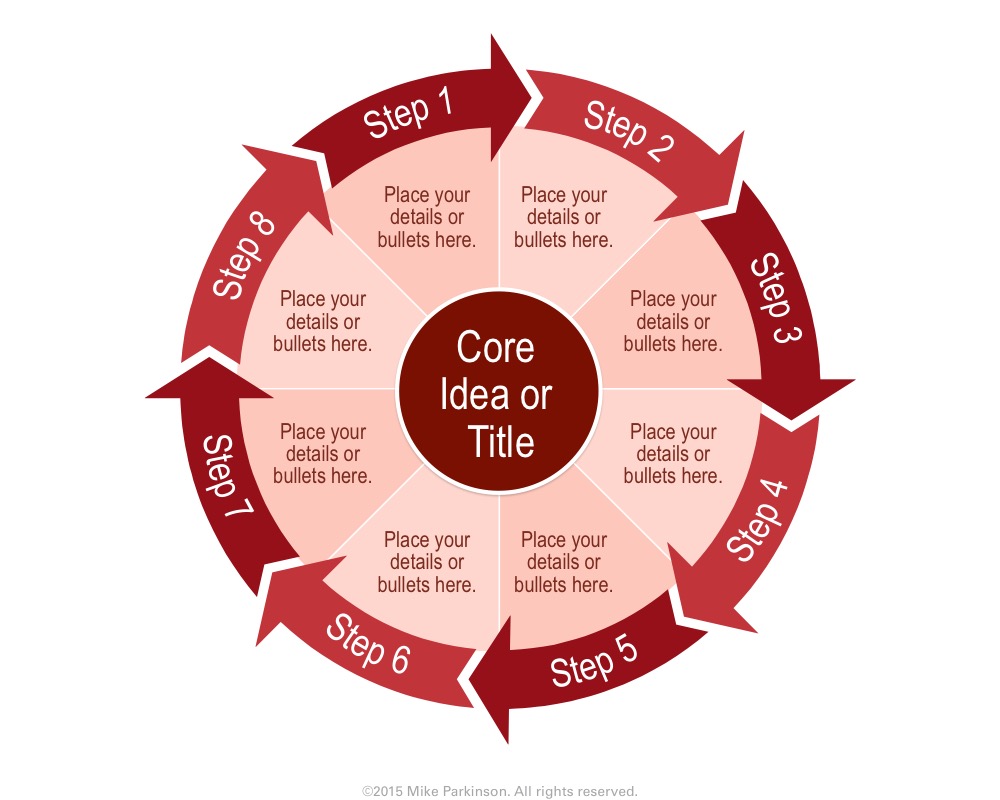
Use this Gear Graphic as to show how parts work together as a whole and a visual metaphor for process…
Use this Gear Graphic as to show how parts work together as a whole and a visual metaphor for process…
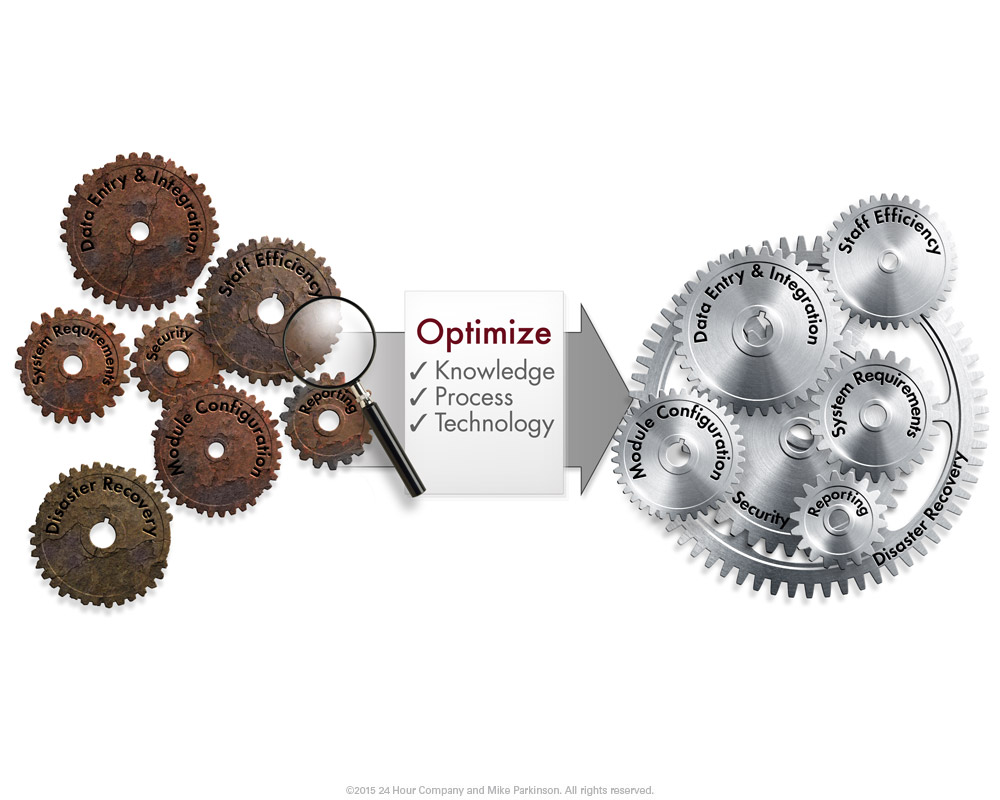
Use this Gear Graphic as to show how parts work together as a whole and a visual metaphor for process…
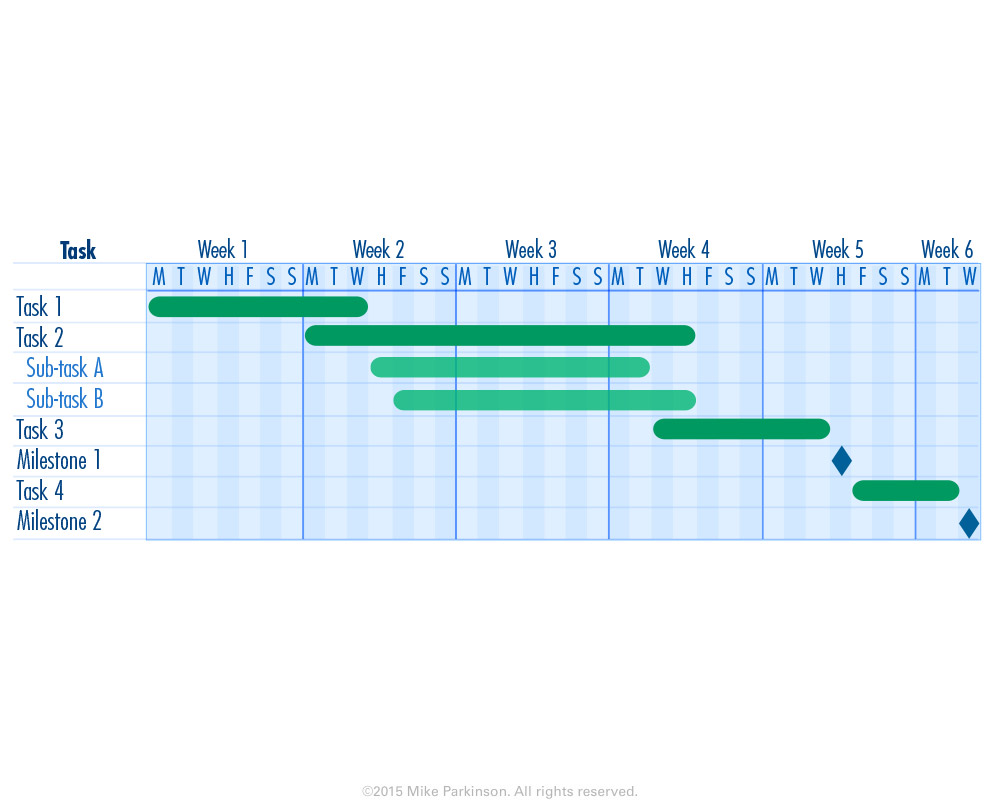
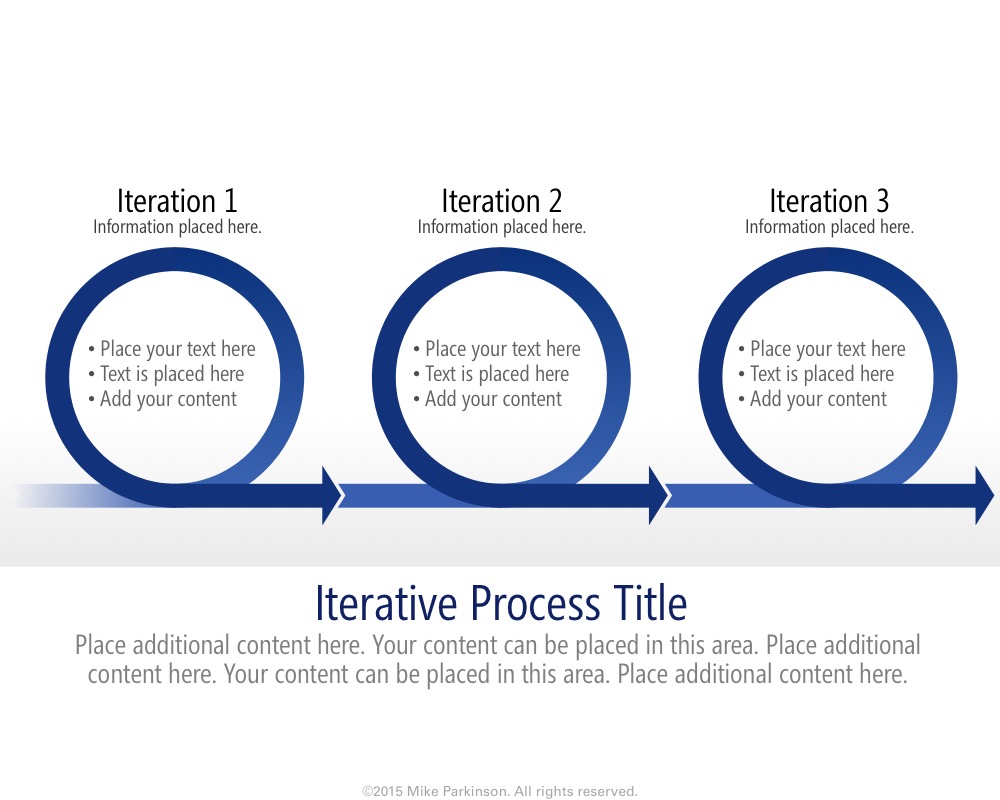
Use this Gantt Chart to communicate schedule and activity for tracking, planning, review purposes. (This chart is NOT data driven.)
Use this Venn Diagram to show the relationship and/or synergy of disparate elements through the overlap of those elements.

Use this Venn Diagram to show the relationship and/or synergy of disparate elements through the overlap of those elements.