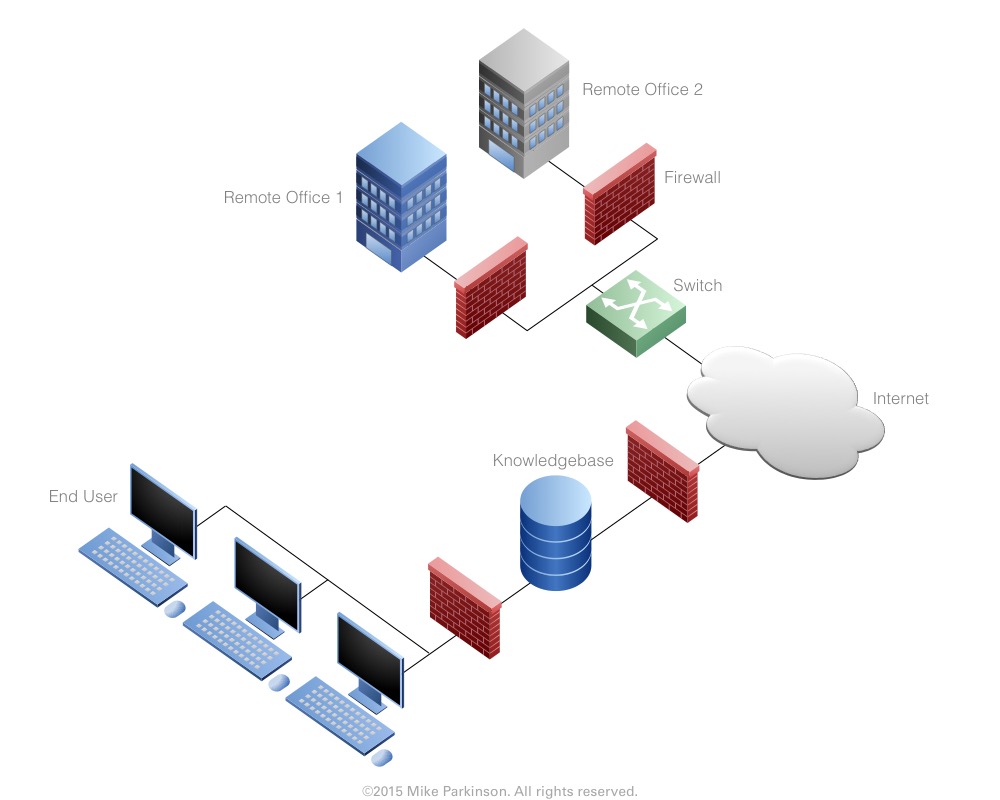
Network Diagram
Use these Network Diagram icons and symbols to build your own Network Diagrams.

Use these Network Diagram icons and symbols to build your own Network Diagrams.
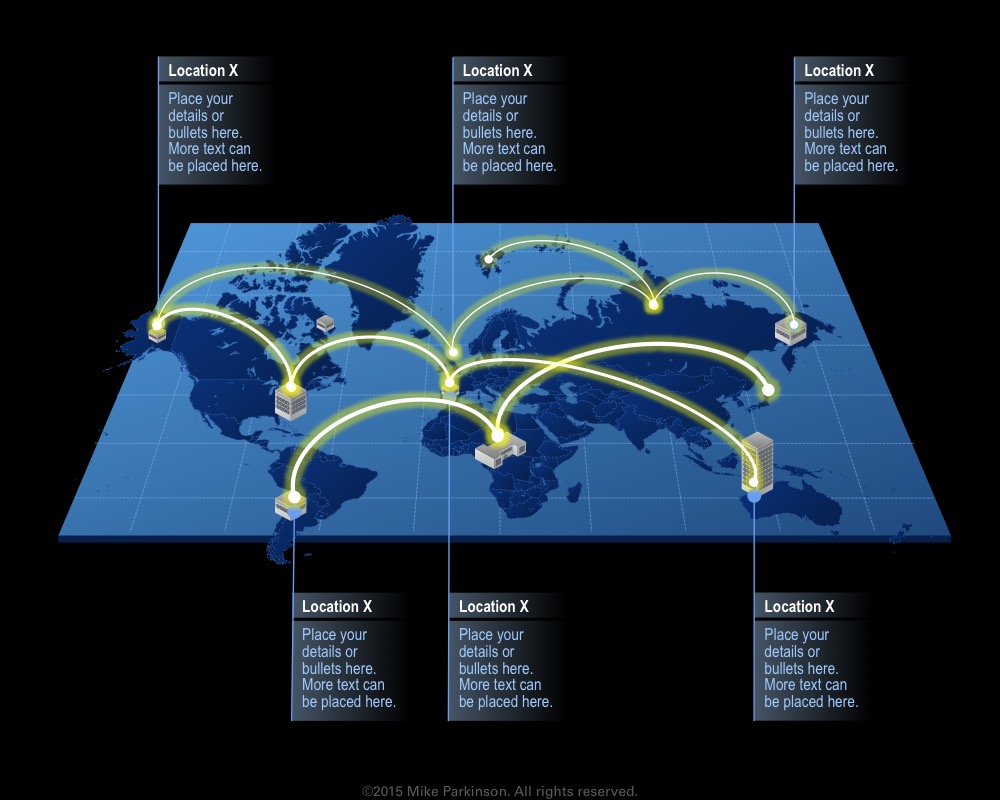
Use this graphic to show regions, countries, cities, and locations of your offices, headquarters, corporate reach, bases, etc.
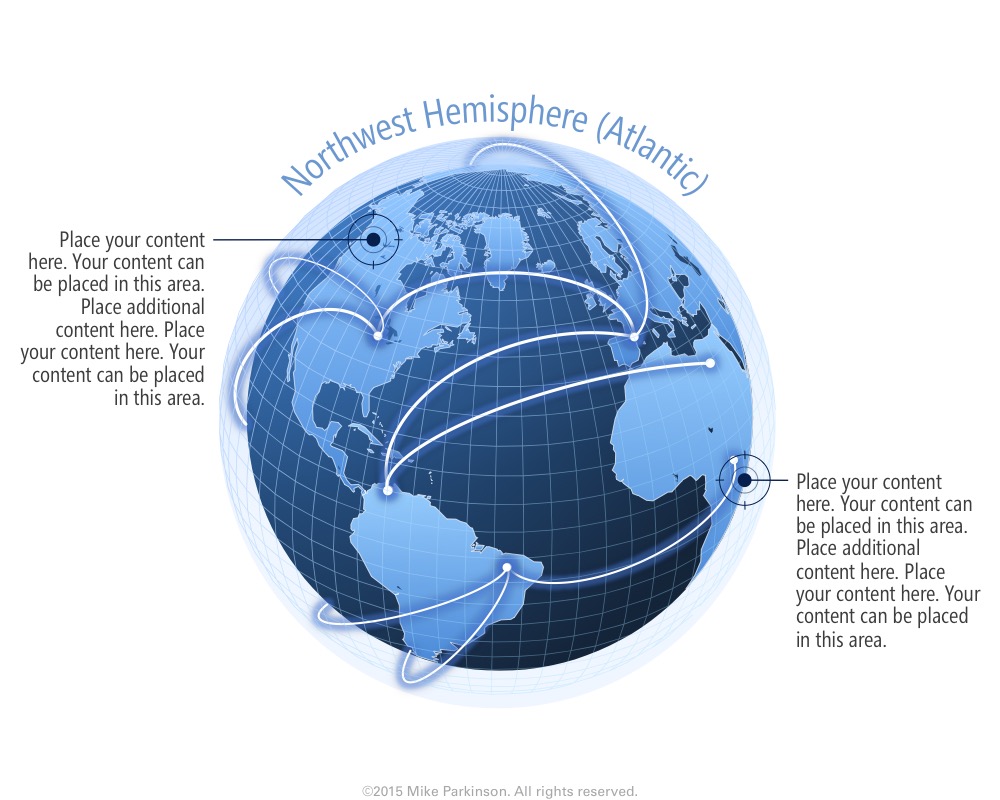
Use this graphic to show regions, countries, cities, and locations of your offices, headquarters, corporate reach, bases, etc.
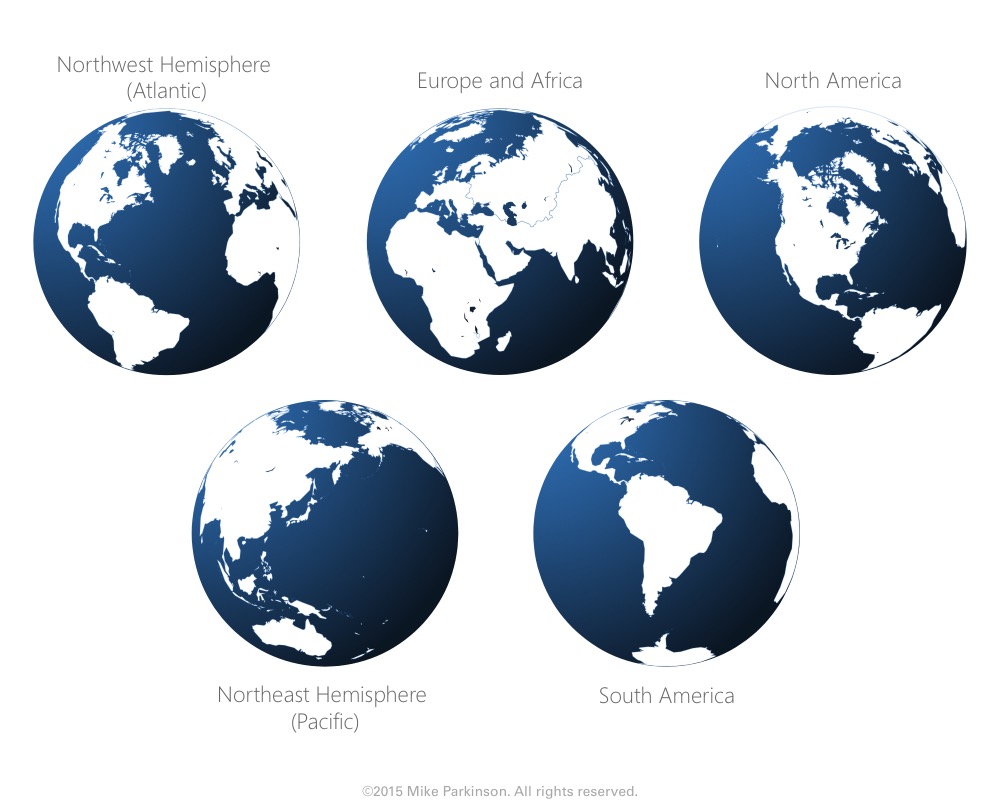
Use this graphic to show regions, countries, cities, and locations of your offices, headquarters, corporate reach, bases, etc.
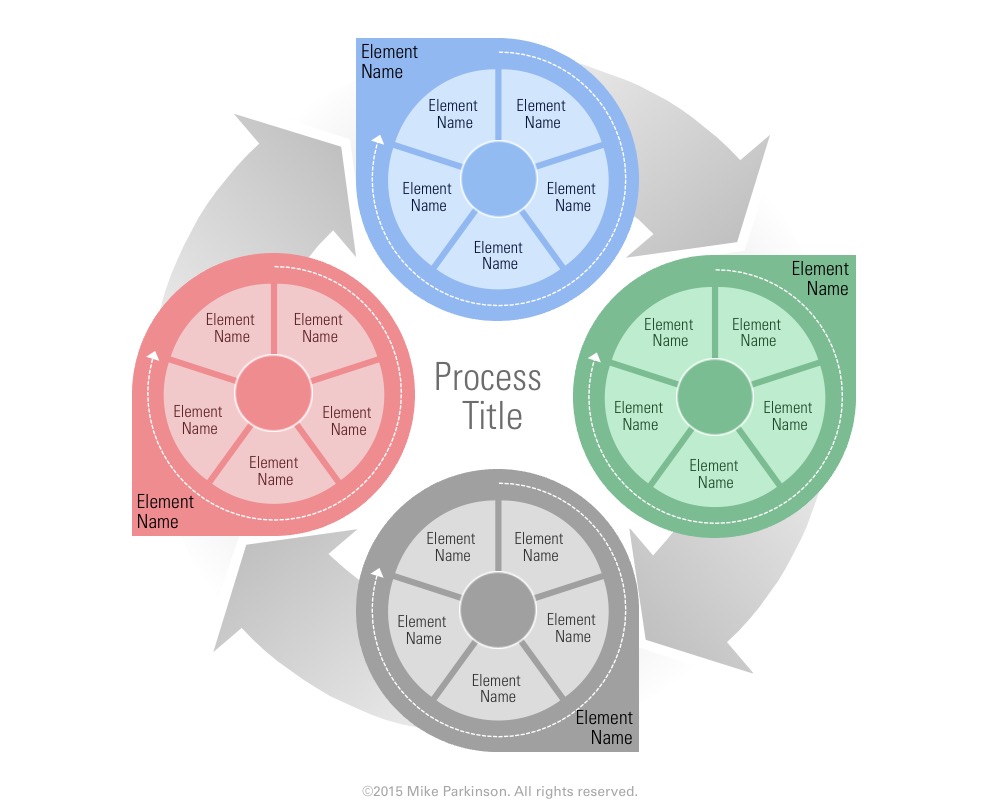
Use this Looping Graphic to show repeatable processes.

Use this Looping Graphic to show repeatable processes.
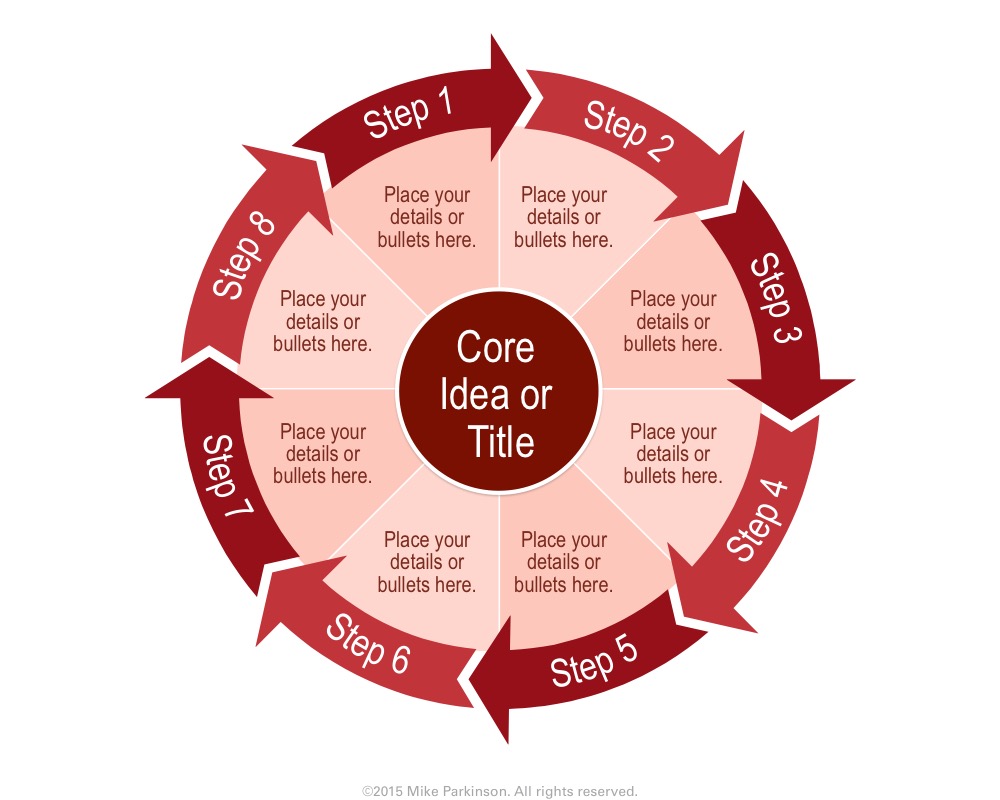
Use this Looping Graphic to show repeatable processes.
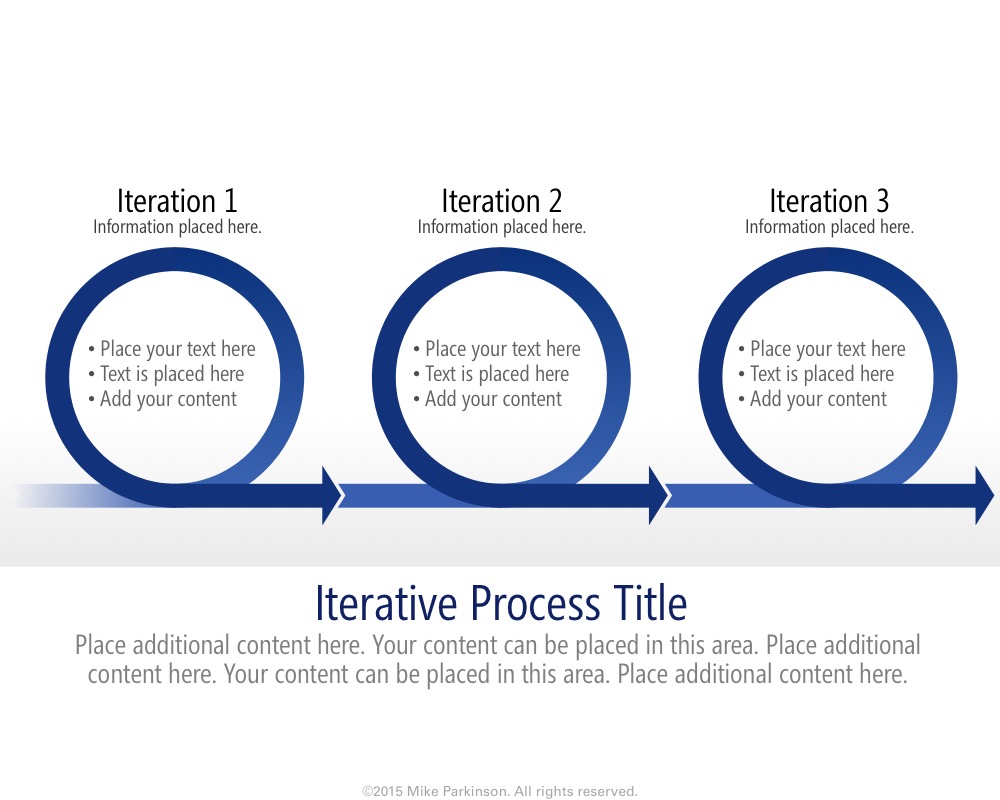
Use this Looping Graphic to show repeatable processes.
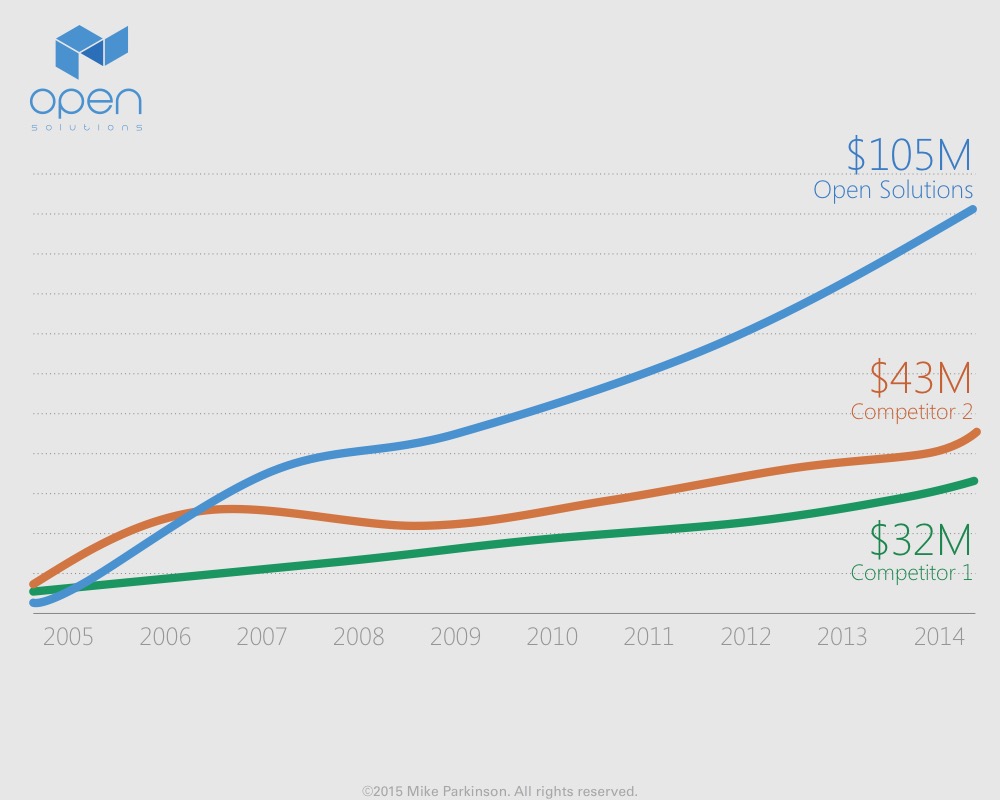
Use this Line Chart/Bar Chart hybrid to show quantitative data. This graphic is data driven.
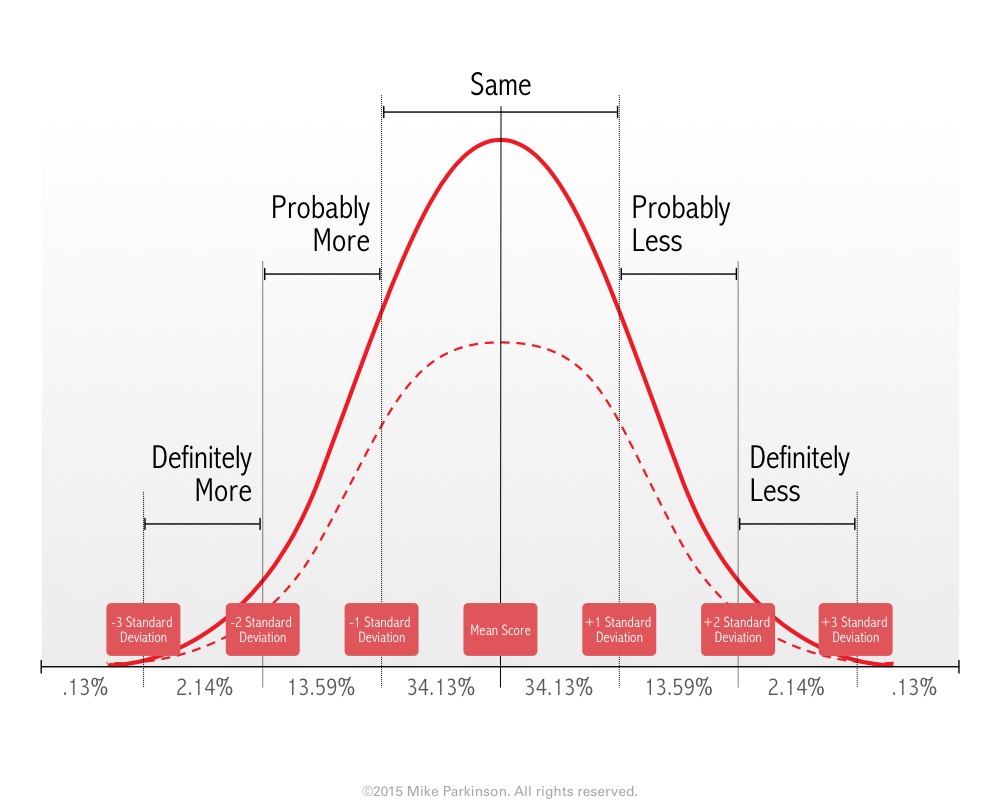
Use this Line Chart/Bar Chart hybrid to show quantitative data. This graphic is data driven.
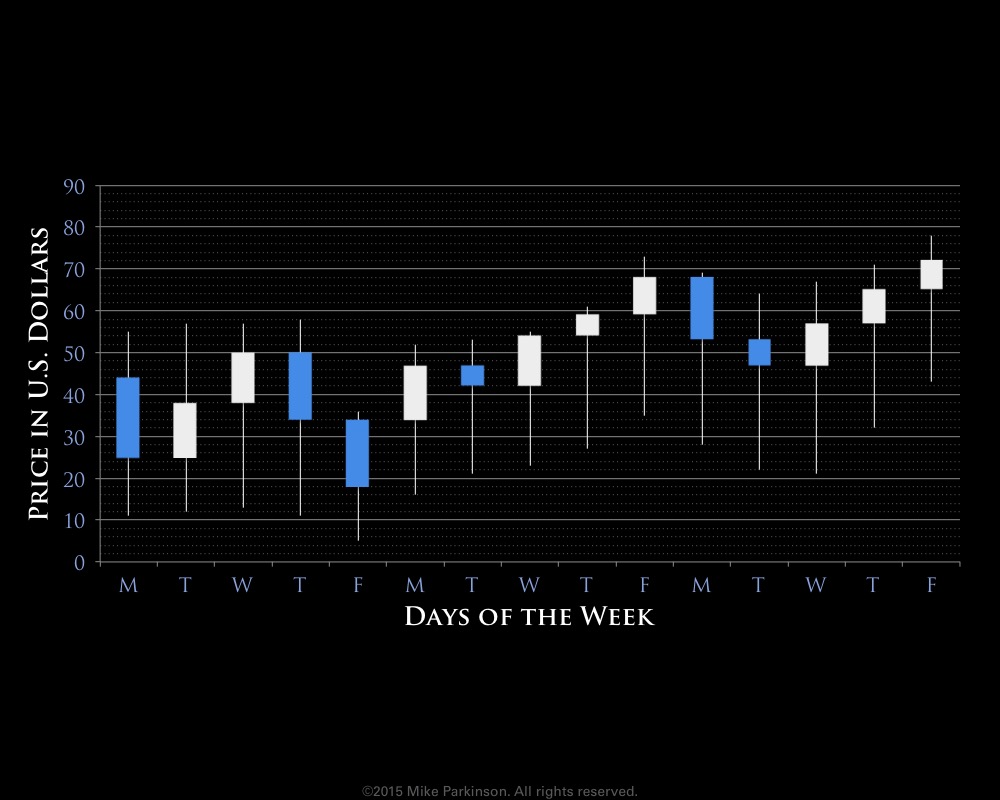
Use this Candlestick Chart to show changes in value and other information pertaining to stocks, bonds, commodities, etc. This graphic…

Use this Gear Graphic as to show how parts work together as a whole and a visual metaphor for process…