This month, Mike Parkinson spoke about AI with GhostRanch Communications on their Presentation Thinking™ podcast.…

Stair Graphics
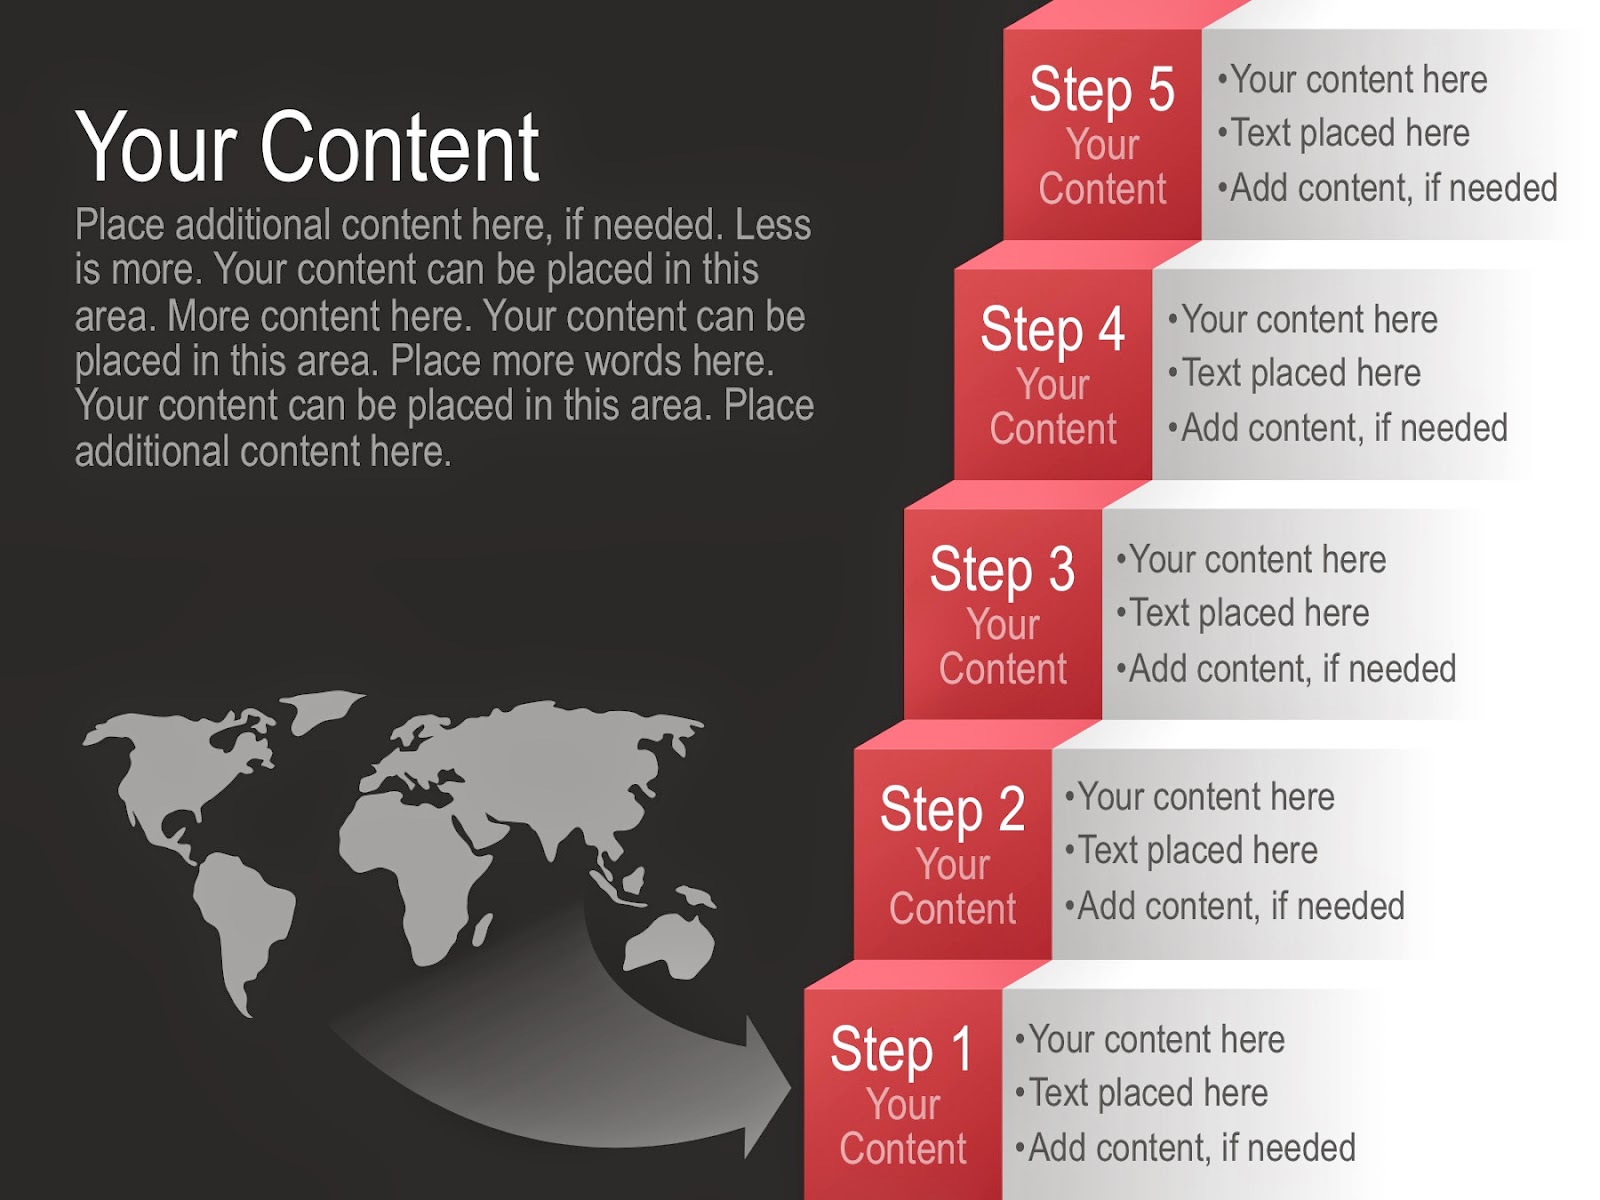
Stair graphics show steps in a process. Use this graphic type as a metaphor for progress.
When combined with a world map, a stair graphic can demonstrate starting or ending points for worldwide distribution or corporate expansion. Animate the map so the countries are highlighted when a specific step is discussed.
Use icons to add visual meaning to each step such as a pointing finger for selection, laptop for searching, satellite for communications, puzzle piece for an item in a process, world for global expansion, and handshake for partnership. Of course, how you define the icons is dependent on the meanings your audience will associate with them.
 |
| Stair_0268 |
Waterfall Diagram
Waterfall Diagrams show a linear progression of steps in a process. Use icons or photos to add visual explanations to each step and help your audience better remember your content.
 |
| Waterfall_0071 |
 |
| Waterfall_0056 |


