Related Projects
Bar Chart Curved
Use this Bar Chart to show amounts, values, and time.
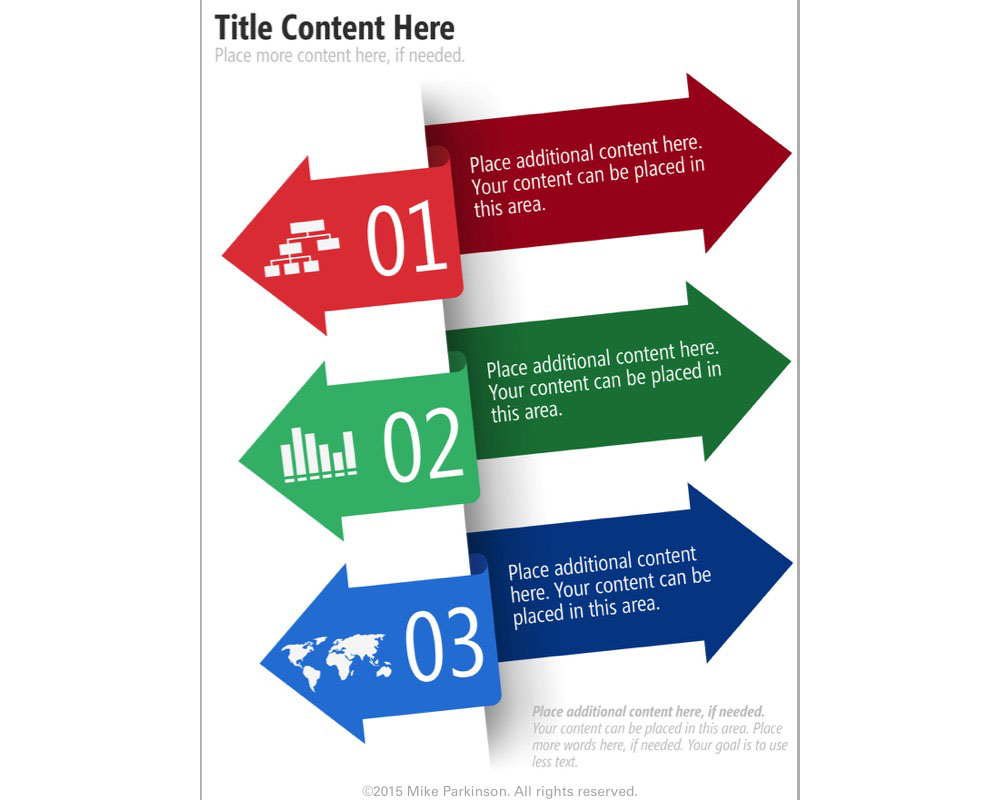
Infographic 10
Use this Infographic to share quantitative data related to a specific topic.
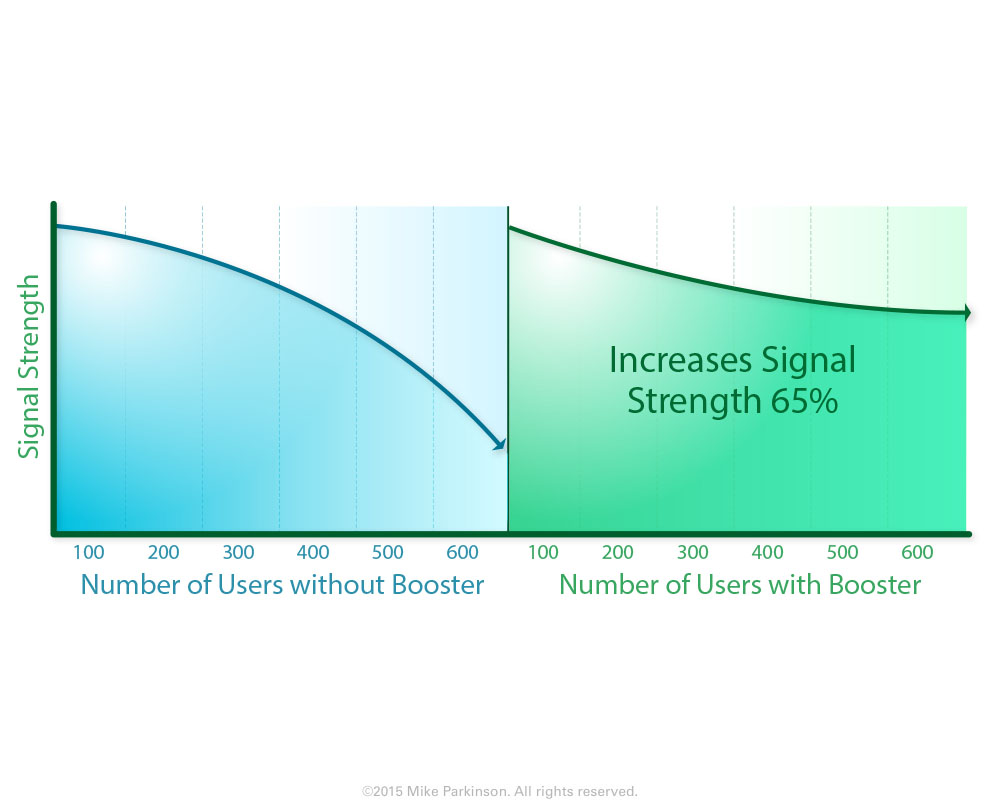
Area Chart 3
Use this Area Chart to show amounts, values, and time. This graphic is data driven.
Area Chart 2
Use this Area Chart to show amounts, values, and time. This graphic is data driven.


