
Bar Chart Curved
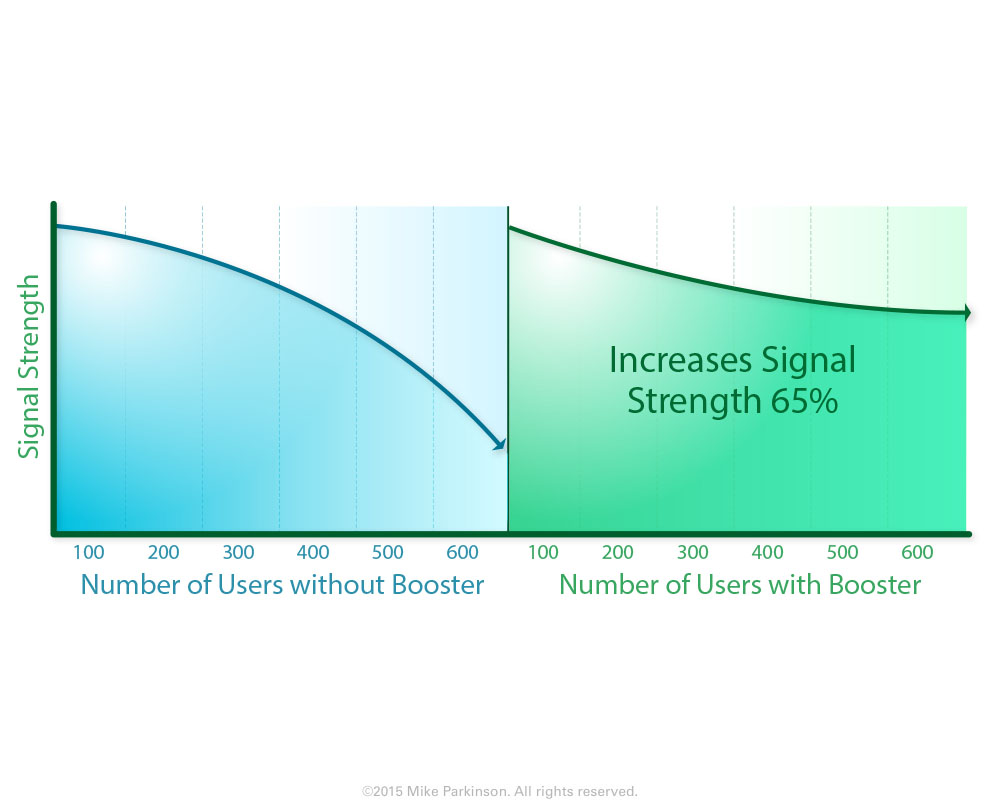
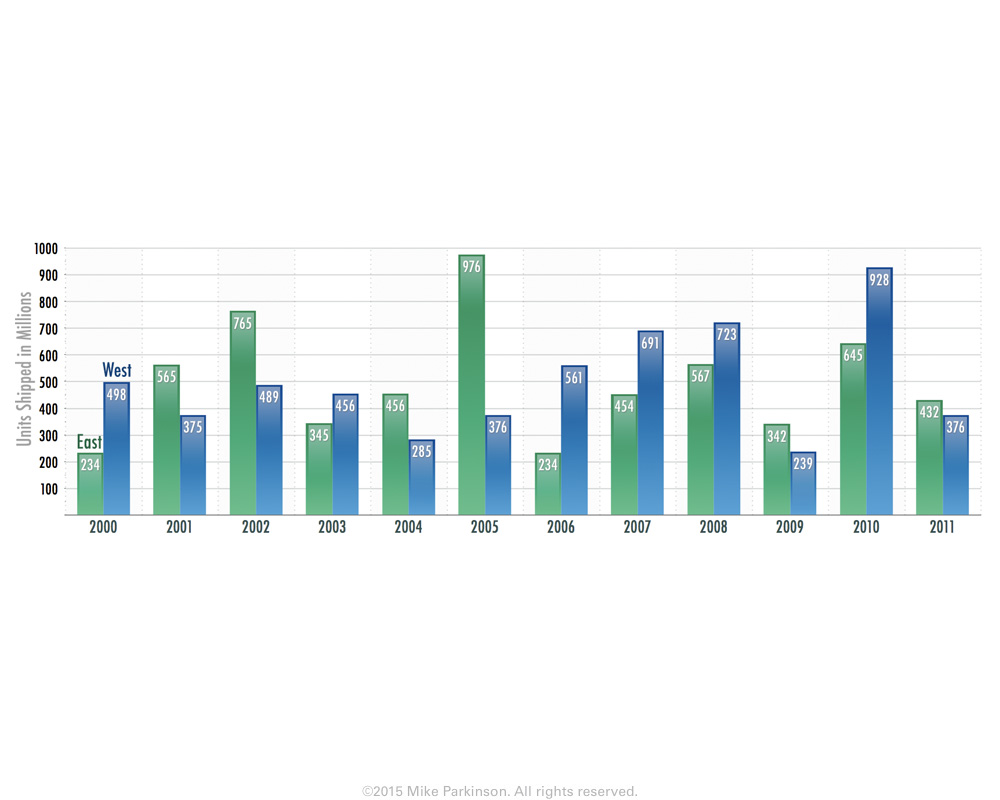
Use this Bar Chart to show amounts, values, and time.

Use this Bar Chart to show amounts, values, and time.
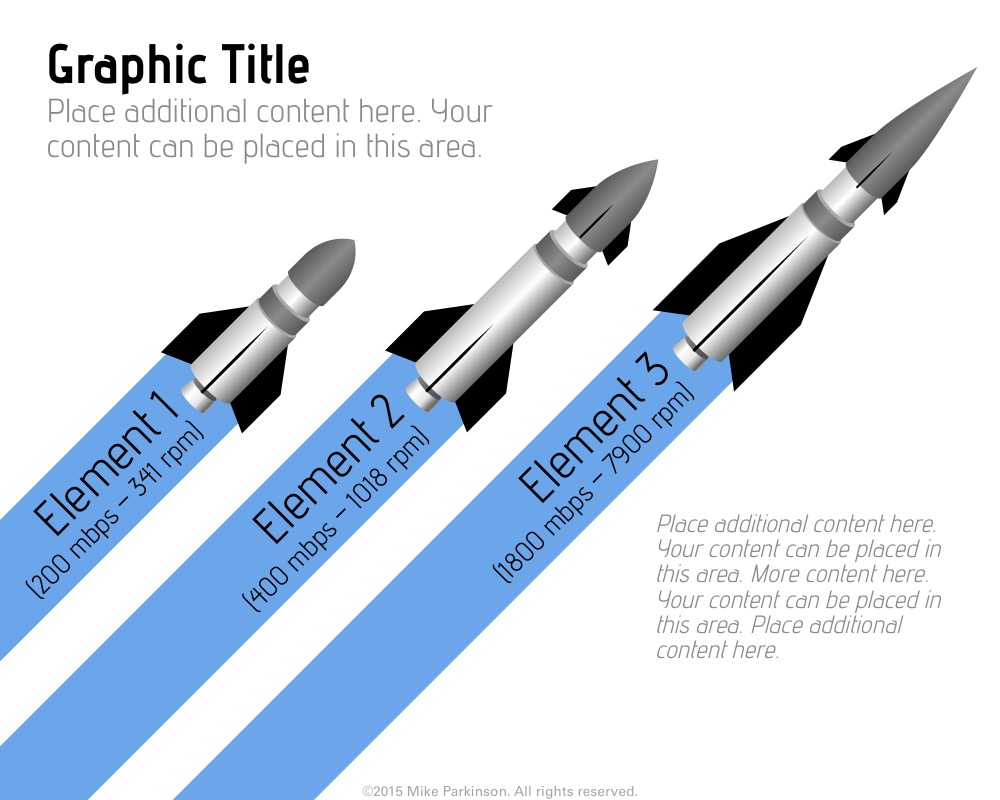
Use these Icons in Infographics or other graphic types to dynamically show movement and transition to a future state.

Use this Infographic to show how elements can nourish your ideas and help them fruit.
Use this Area Chart to show amounts, values, and time. This graphic is data driven.

Use this Area Chart to show amounts, values, and time. This graphic is data driven.
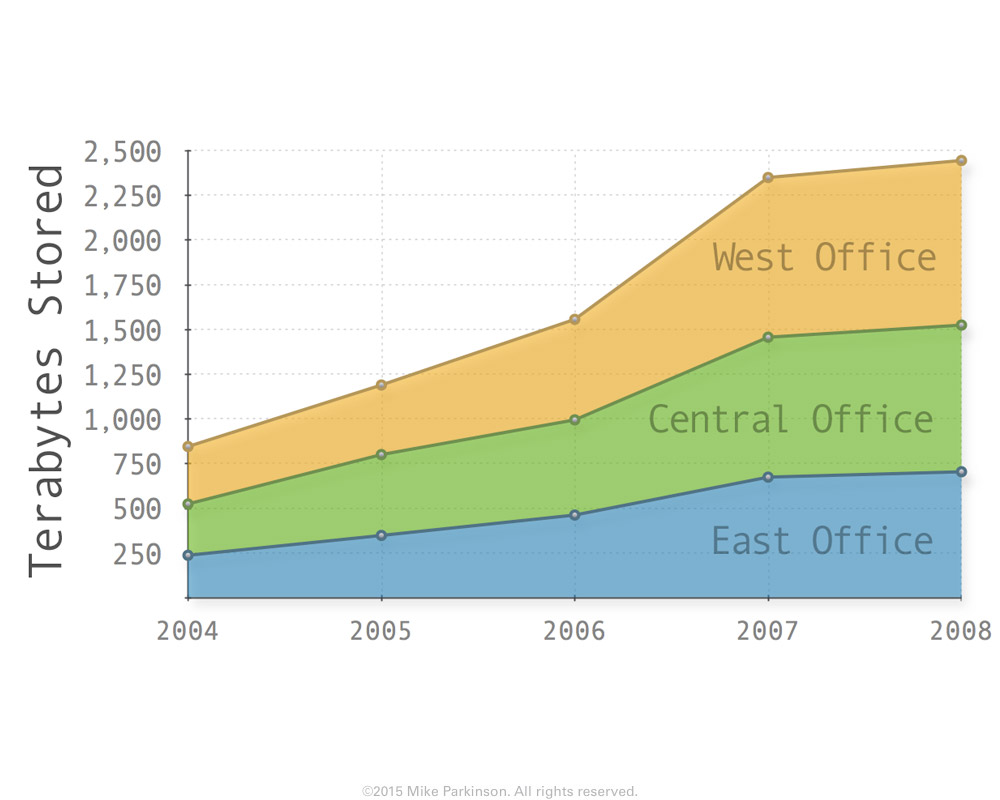
Use this Area Chart to show amounts, values, and time. This graphic is data driven.
Use this Bar Chart to show amounts, values, and time. This graphic is data driven.
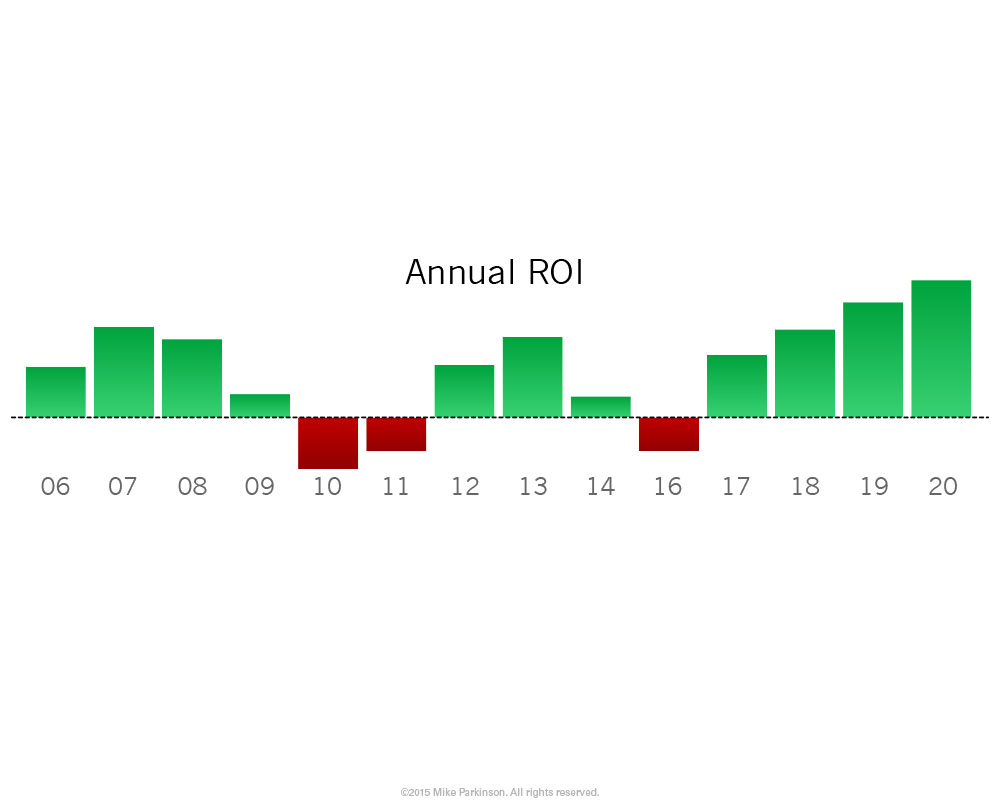
Use this Bar Chart to show amounts, values, and time. This graphic is data driven.
Use this Bar Chart to show amounts, values, and time. This graphic is data driven.
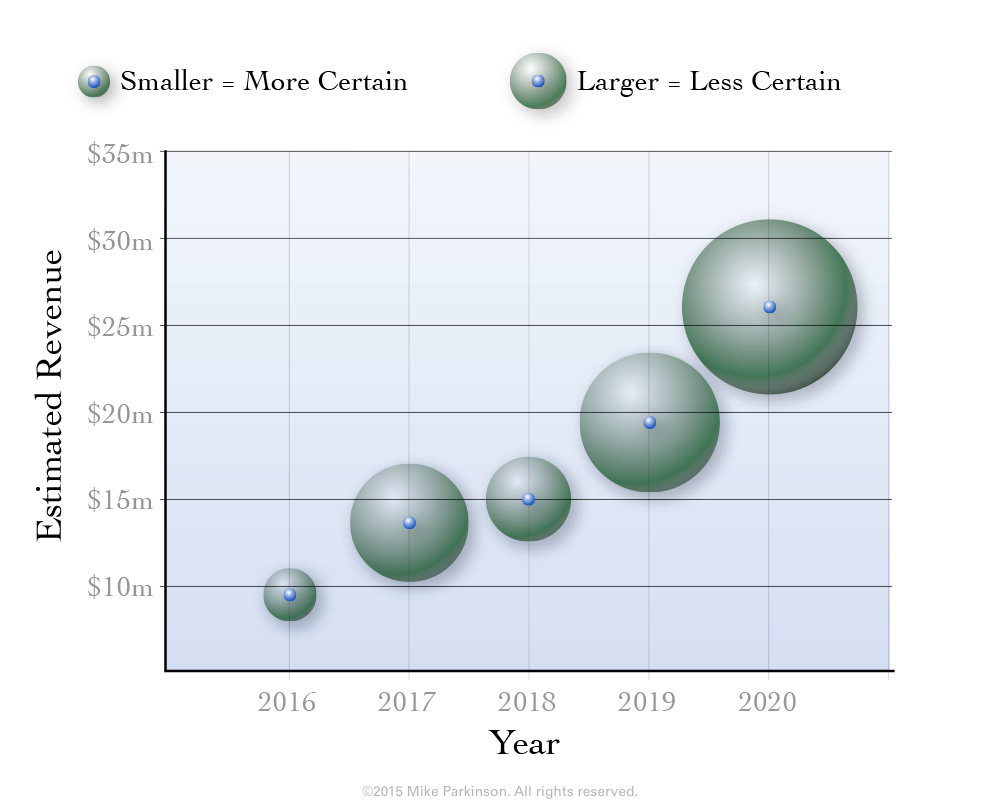
Use this Bubble Chart graphic to show amounts, values, and time. This graphic is data driven.
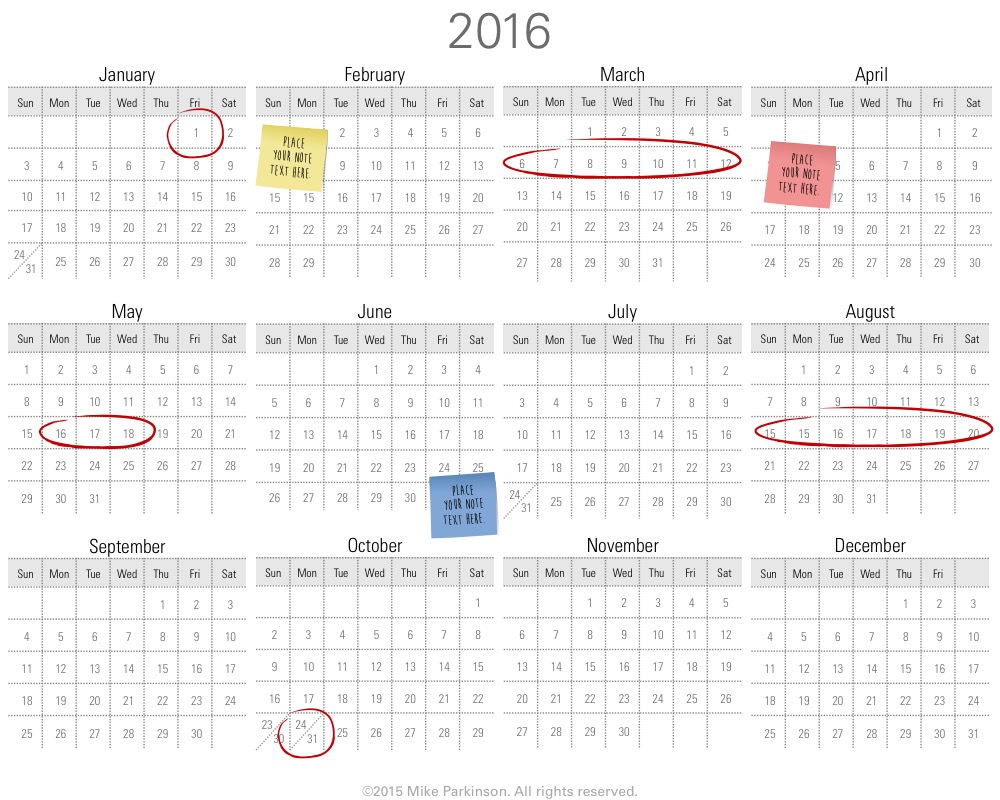
Use this Calendar to show schedules, events, and activities.
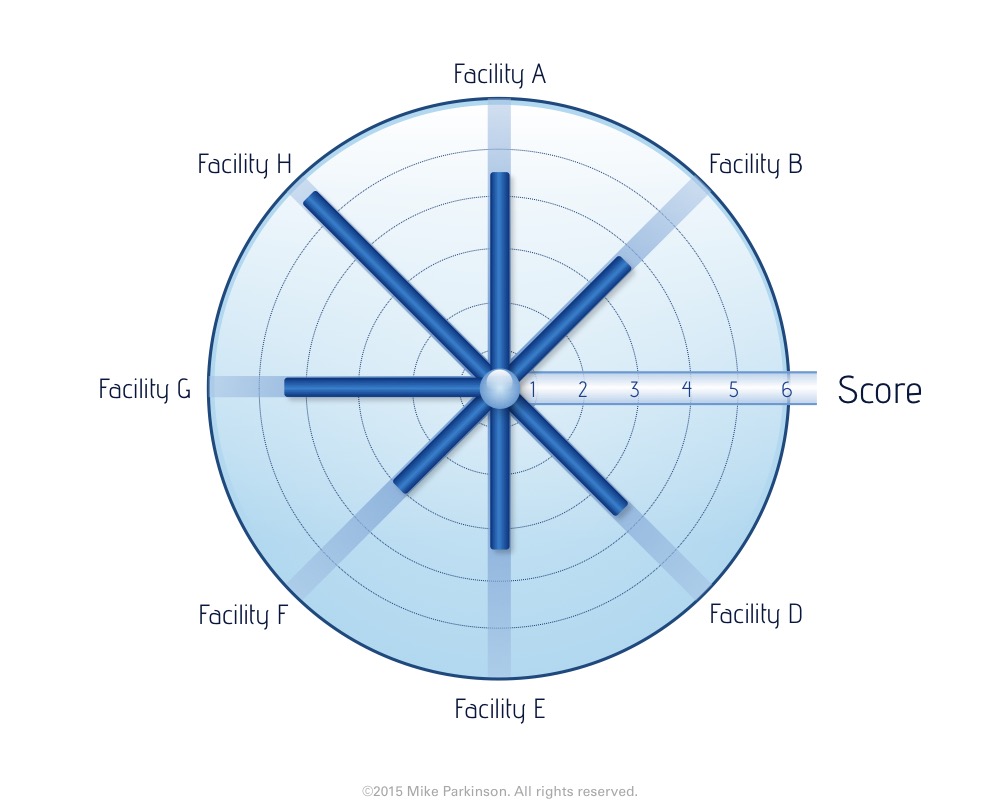
Use this Circle Chart to show changing amounts, values, or time. (This graphic is NOT data driven.)