CreativePro Week July 8–12 Washington, DC (or attend online) Save $100 on multi-day passes with…

Infographics are a great way to convey information in a visually pleasing way. People are more likely to engage with pictures and colors, rather than just a long block of texts. This is why they are especially useful for explaining something that can typically be quite tedious, such as an annual report. Check out these annual report designers for some ideas on how infographics can help make your report more engaging. Infographics can also be a great marketing tool, especially if they go viral.
Making an infographic is relatively easy. Making it viral is the hard part. Here is a way to do it:
STEP 1: Start with a topic that is popular (i.e., in the news, trending on social media).
STEP 2: Choose a provocative title that mentions the hot topic. This is your headline. It should give people a reason to care about your infographic.
STEP 3: Find facts that support your title / headline. Break the information into bite-sized, digestible chunks and arrange them to tell a story.
STEP 4: Render the infographic using your favorite graphics software or an online infographic tool such as the following:
Tip: Here is a Graphic Cheat Sheet to help you pick the right graphic type. (I am not including my process for turning words into an infographic my focus is on making it viral.)
STEP 5: Post your infographic everywhere you can. Perhaps, you could include the inforgraphic in a TikTok video too. Before you do this, you may wish to check out UseViral to understand how the platform works. Moreover, include “share” buttons where possible. Reach out to news sites that are seeking topical content and ask them if they would like to share your infographic. (It is free content for them and infographics are a popular means of getting information.)
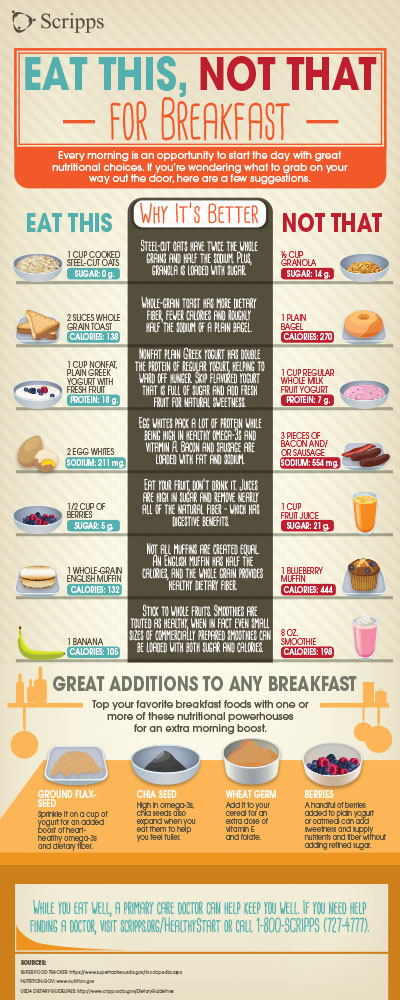
Below is an example of a viral infographic.
Related Posts