Conveyor Belt 2
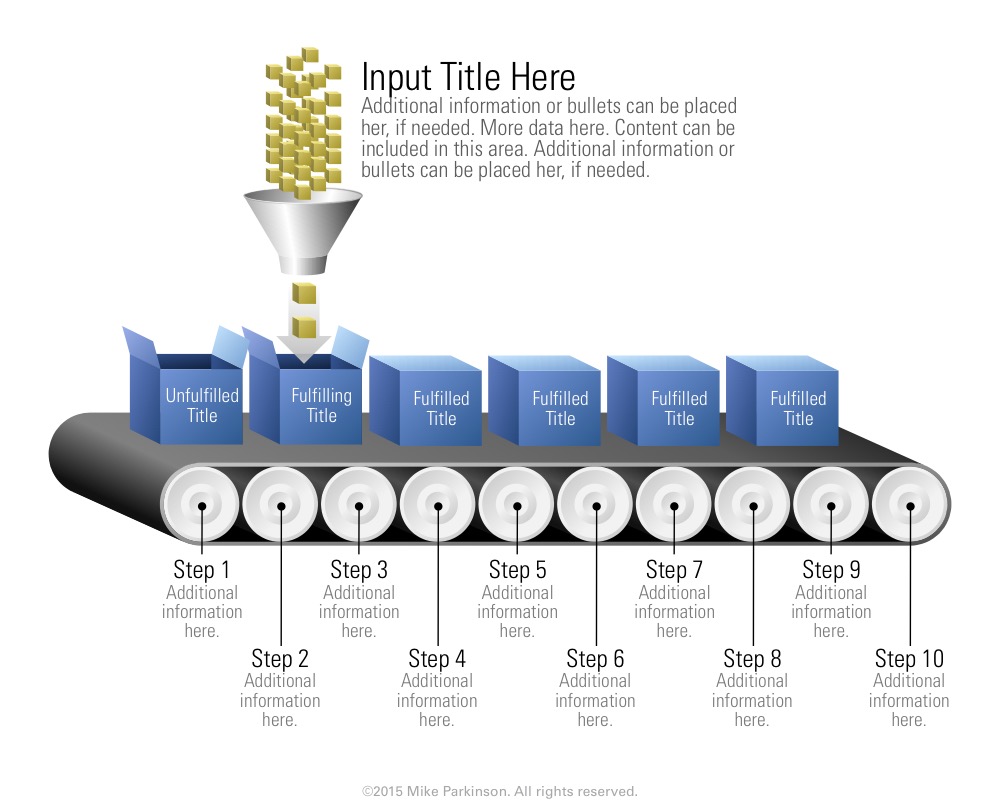
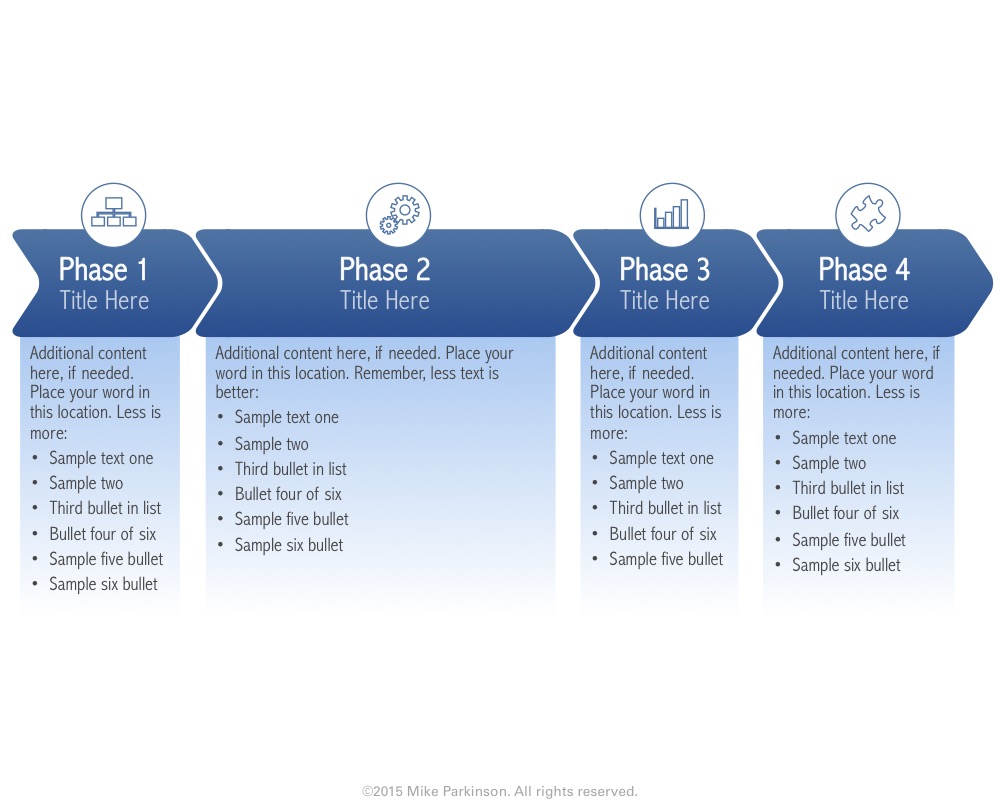
Use this Conveyor Belt Graphic to illustrate a repeatable linear process.

Use this Conveyor Belt Graphic to illustrate a repeatable linear process.
Use this Conveyor Belt Graphic to illustrate a repeatable linear process.
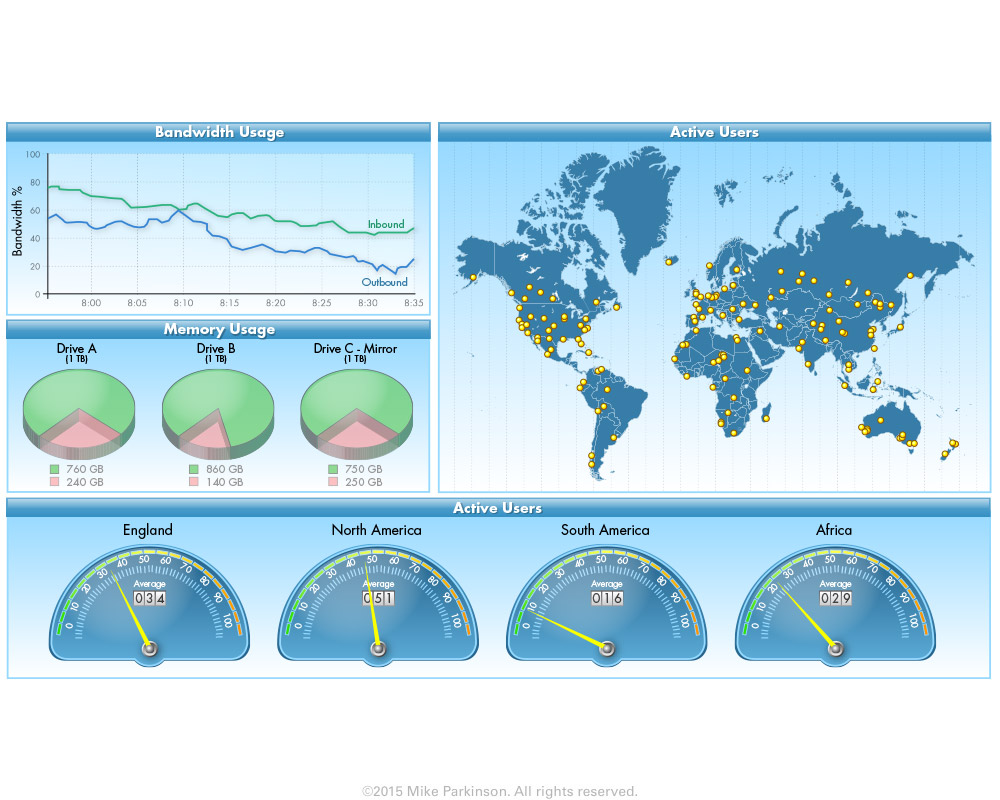
Use this Dashboard Graphic to show multiple metrics in one consolidated format. The line chart and pie charts are data…
Use this Dashboard Graphic to show multiple metrics in one consolidated format. The line chart and pie charts are data…
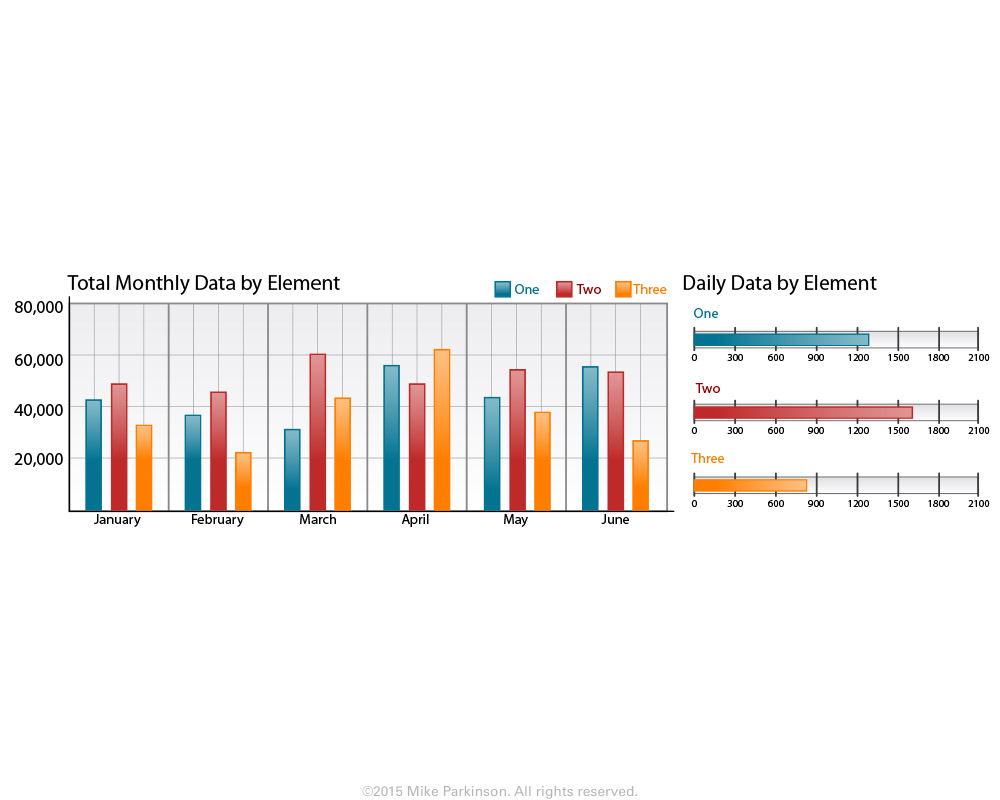
Use this Dashboard Graphic to show multiple metrics in one consolidated format. The line chart and pie charts are data…
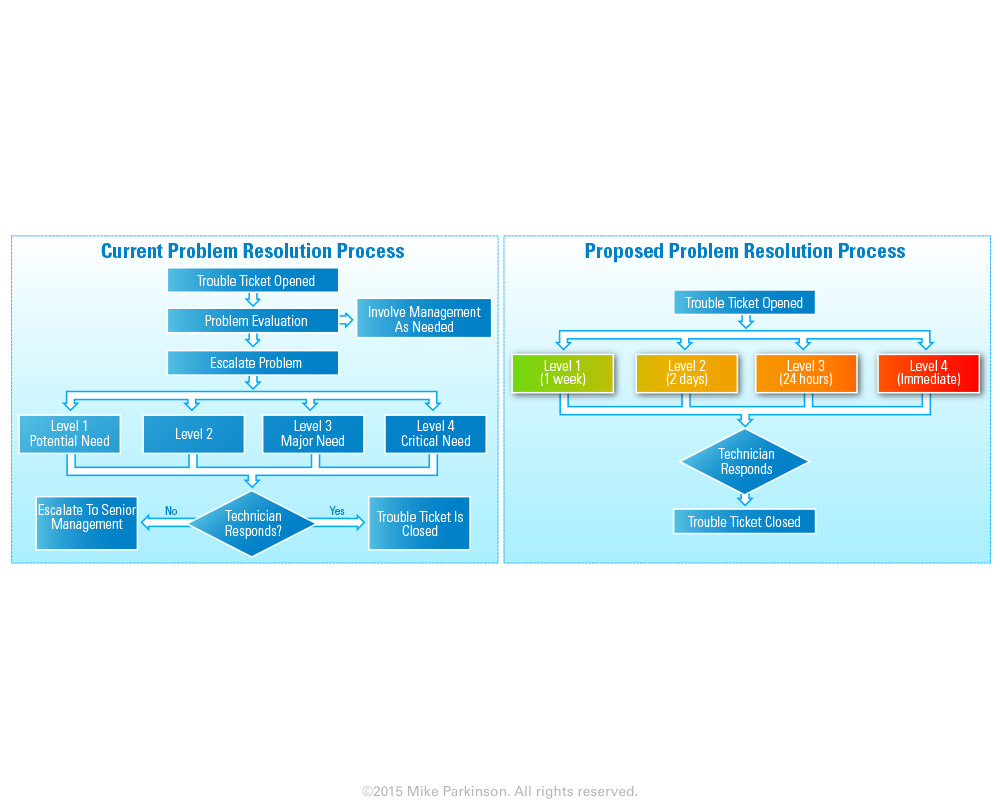
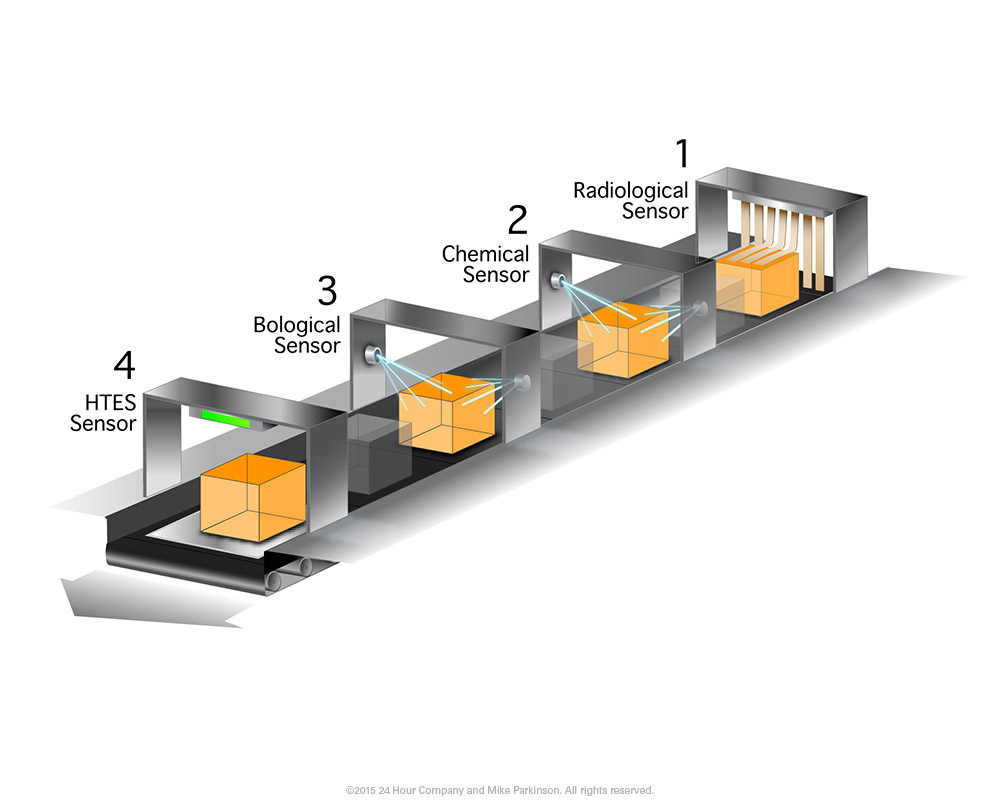
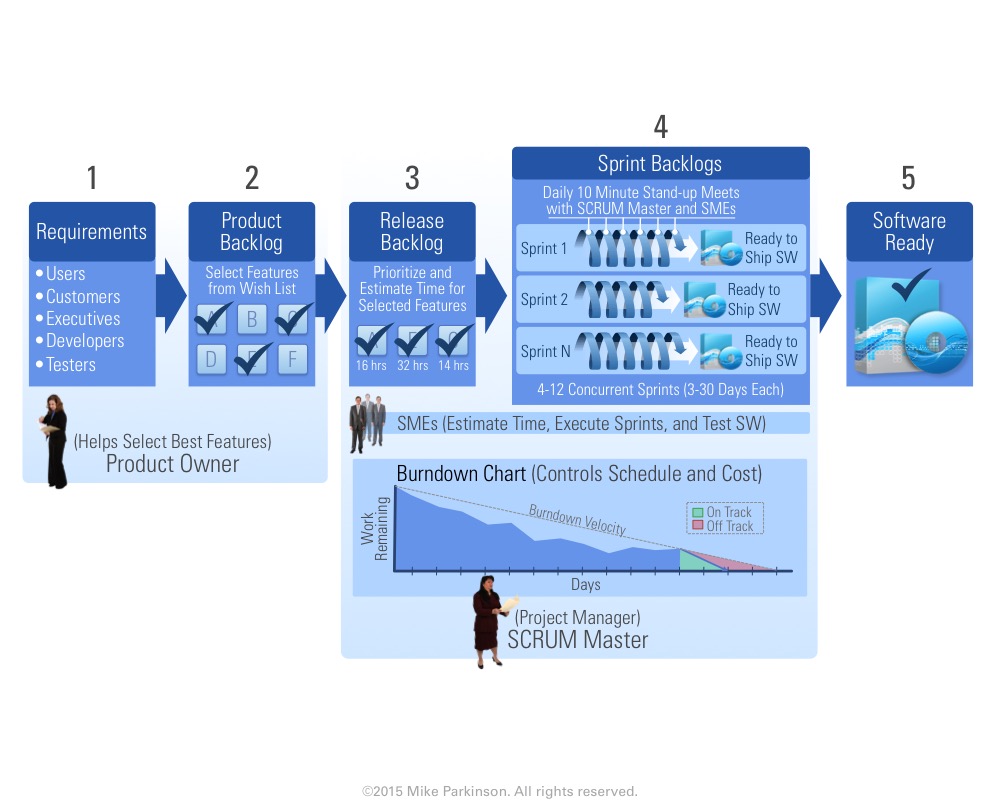
Use this Process Diagram to show relationships, influences, and interactions.

Use this Process Diagram to show relationships, influences, and interactions.
Use this Process Diagram to show relationships, influences, and interactions.

Use this Process Diagram to show relationships, influences, and interactions.
Use this Process Diagram to show relationships, influences, and interactions.
Use this Process Diagram to show relationships, influences, and interactions.

Use this Process Diagram to show relationships, influences, and interactions.