
Circle Chart
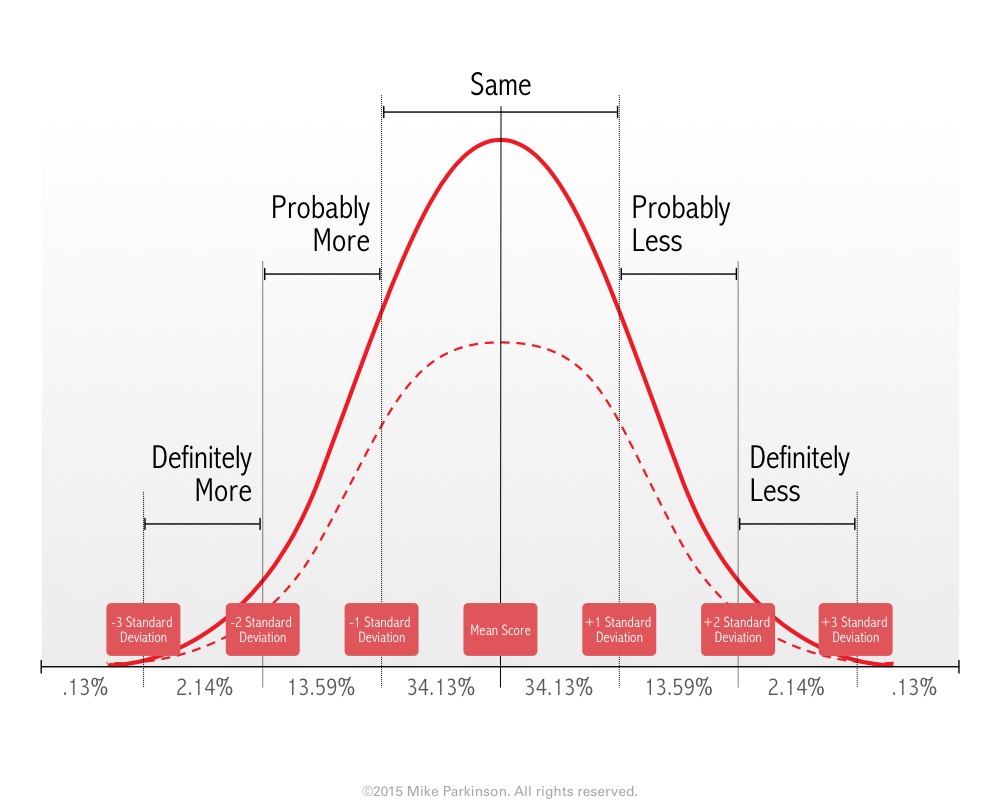
Use this Circle Chart to show changing amounts, values, or time. (This graphic is NOT data driven.)

Use this Circle Chart to show changing amounts, values, or time. (This graphic is NOT data driven.)
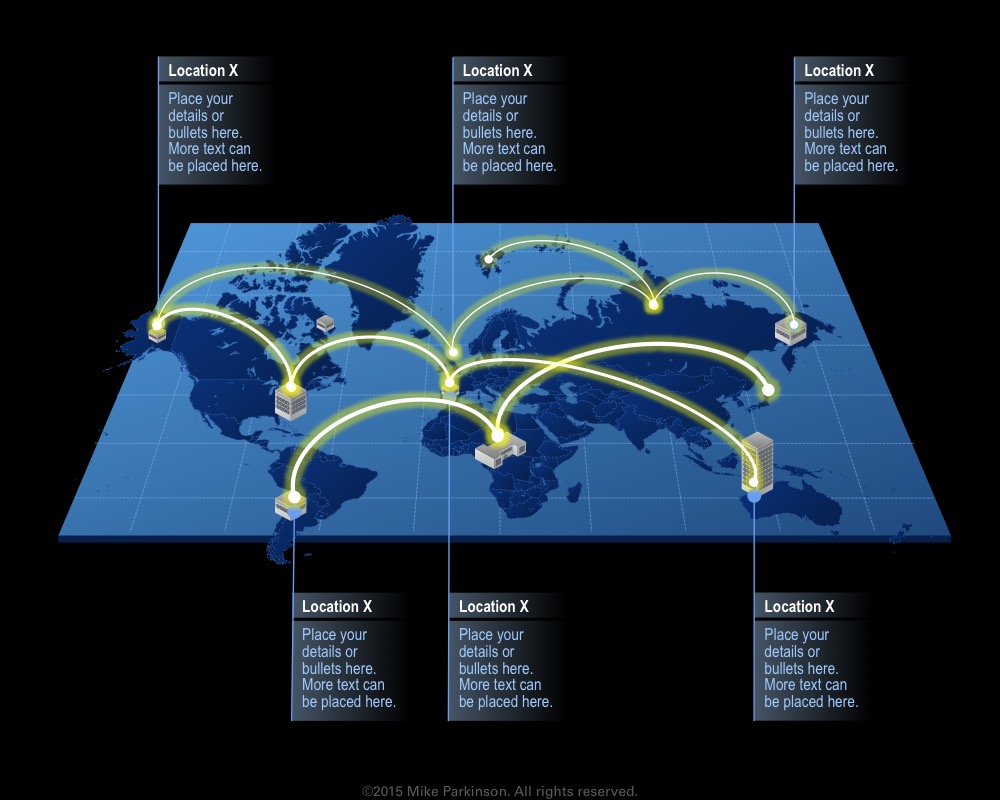
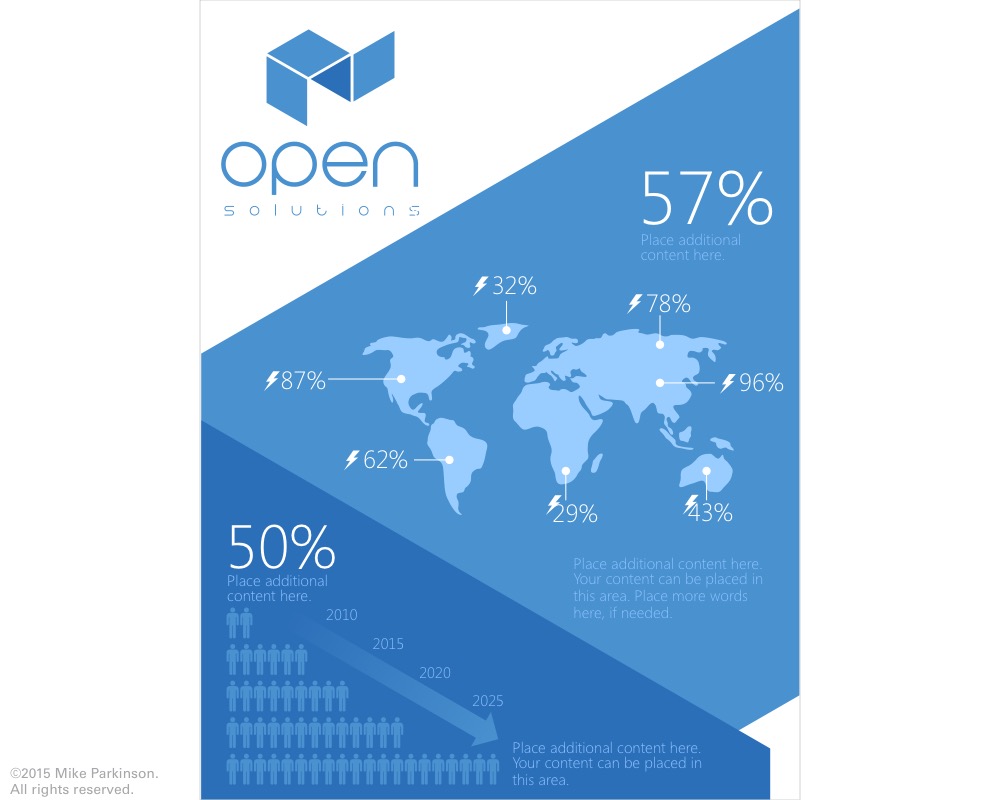
Use this graphic to show regions, countries, cities, and locations of your offices, headquarters, corporate reach, bases, etc.
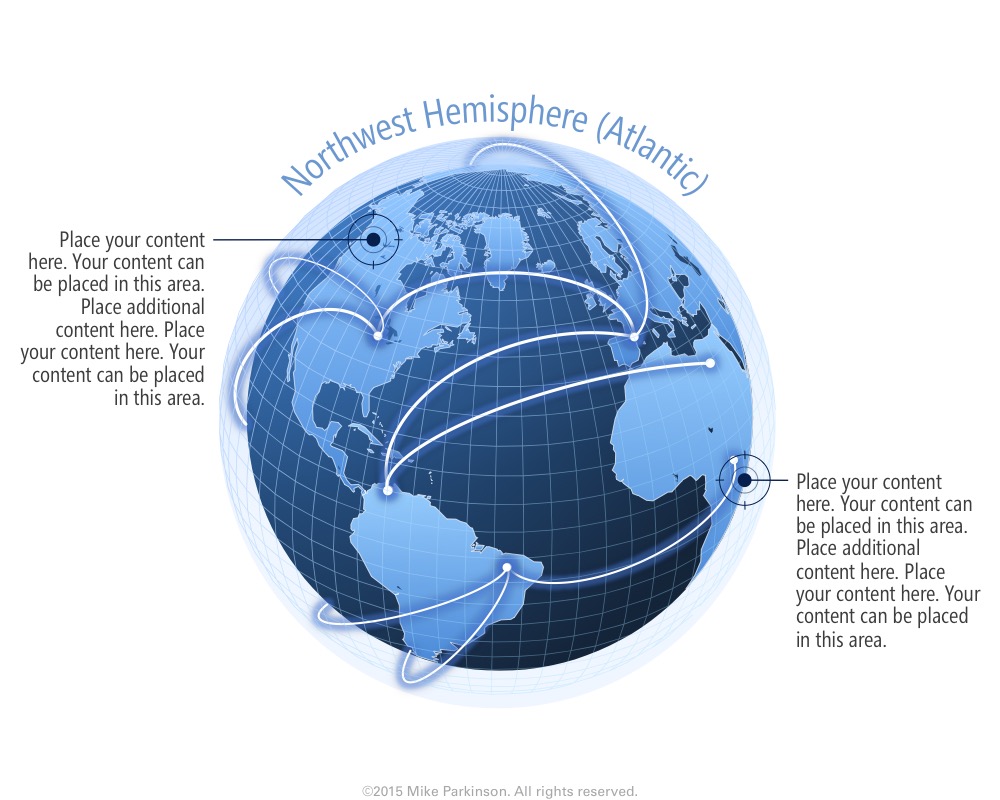
Use this graphic to show regions, countries, cities, and locations of your offices, headquarters, corporate reach, bases, etc.
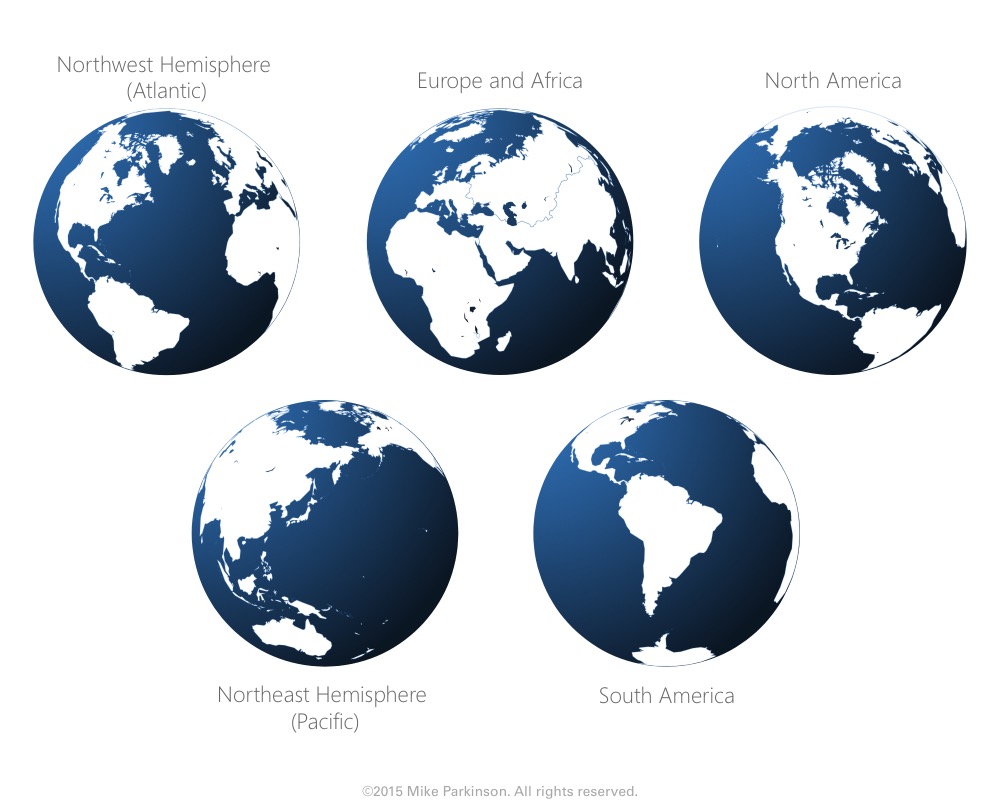
Use this graphic to show regions, countries, cities, and locations of your offices, headquarters, corporate reach, bases, etc.
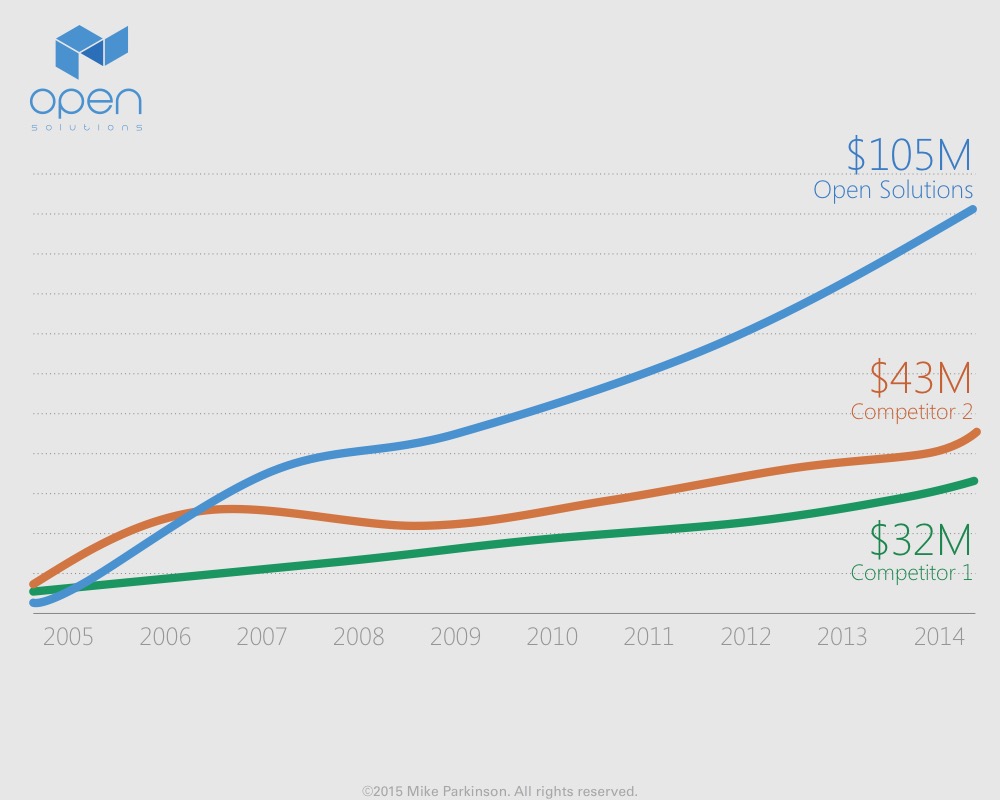
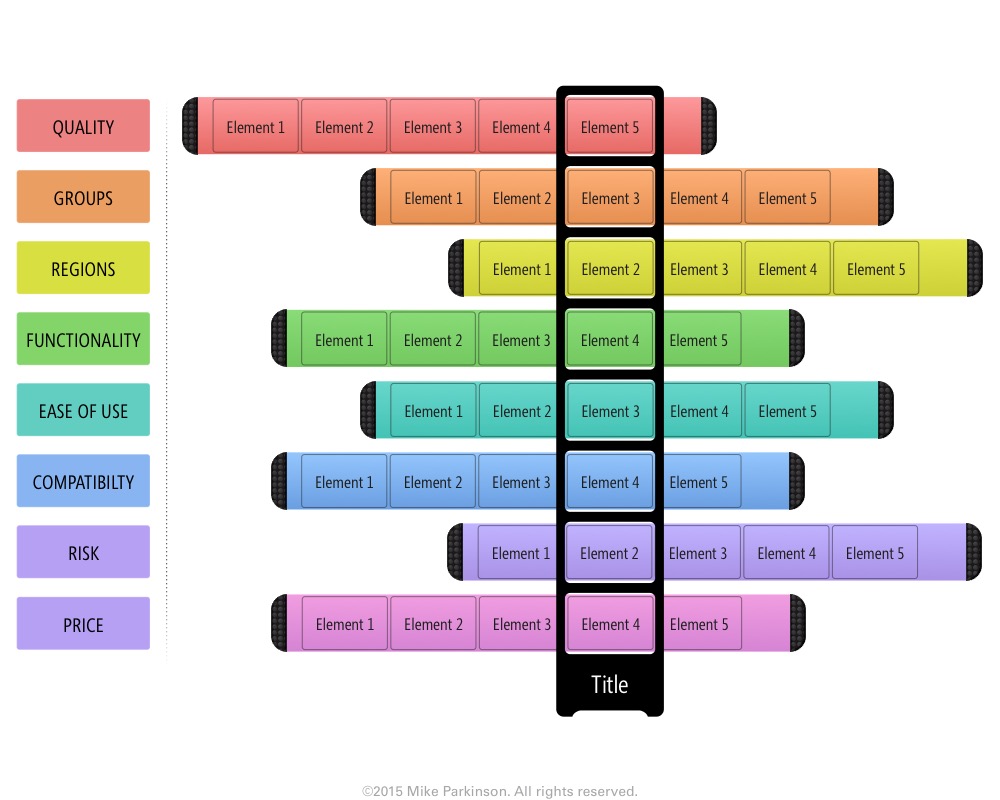
Use this Line Chart/Bar Chart hybrid to show quantitative data. This graphic is data driven.
Use this Line Chart/Bar Chart hybrid to show quantitative data. This graphic is data driven.

Use this Table to correlate data along multiple axes.
Use this Table to correlate data along multiple axes.
Use this Table to correlate data along multiple axes.
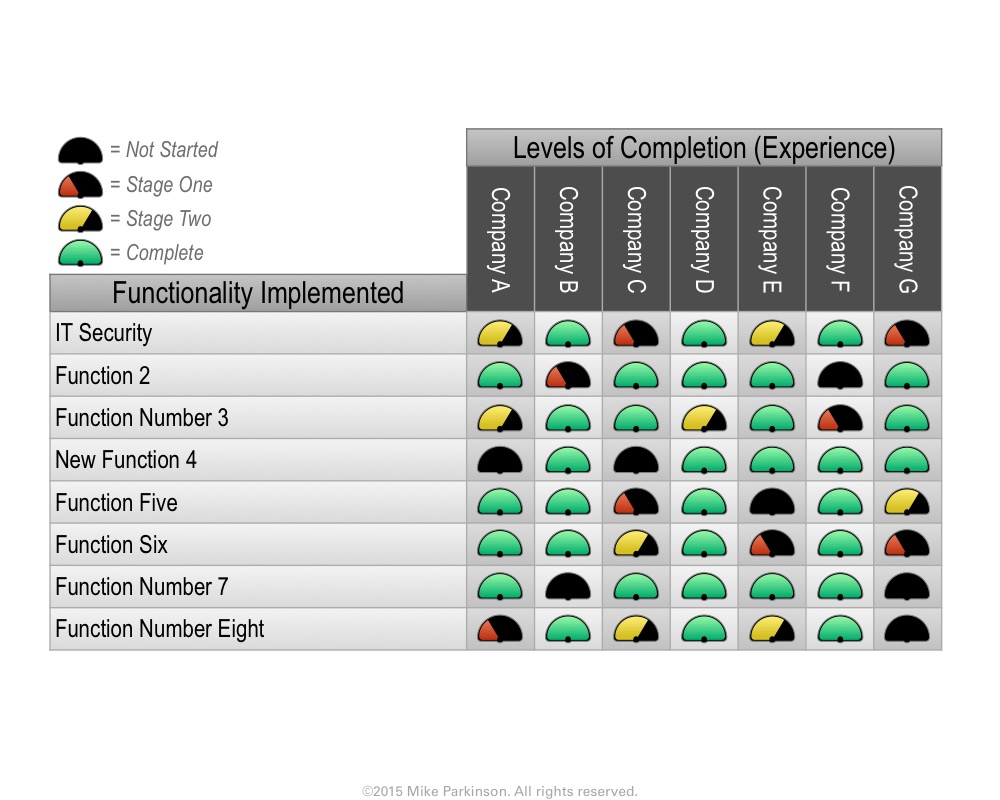
Use this Table to correlate data along multiple axes.
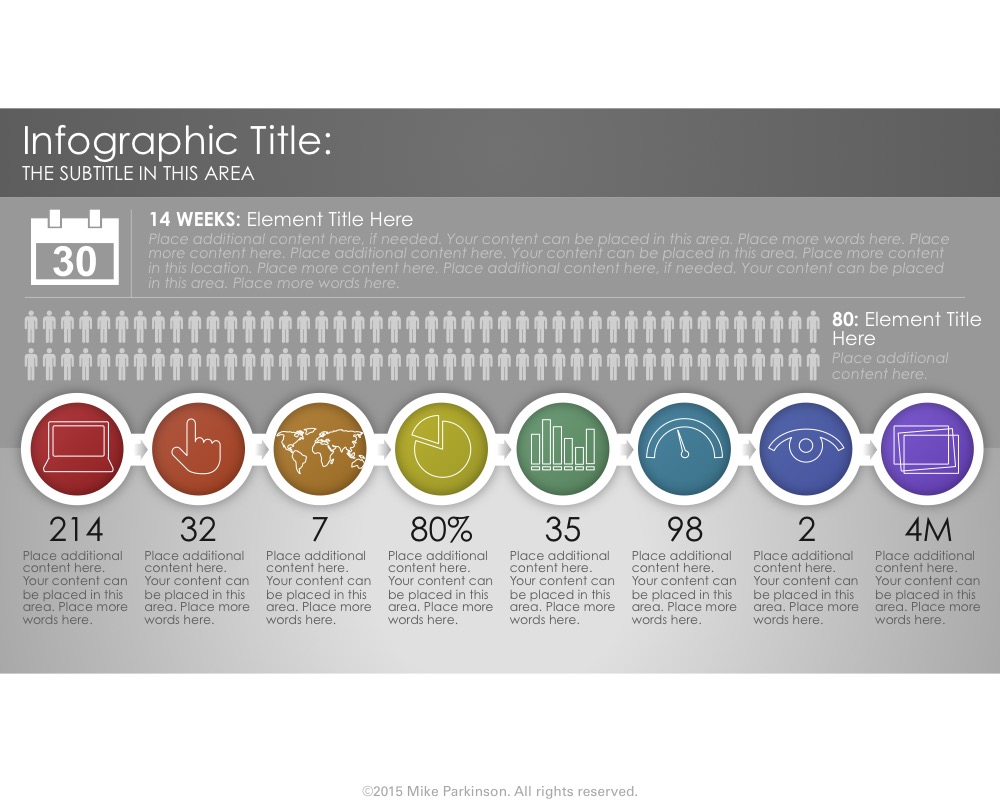
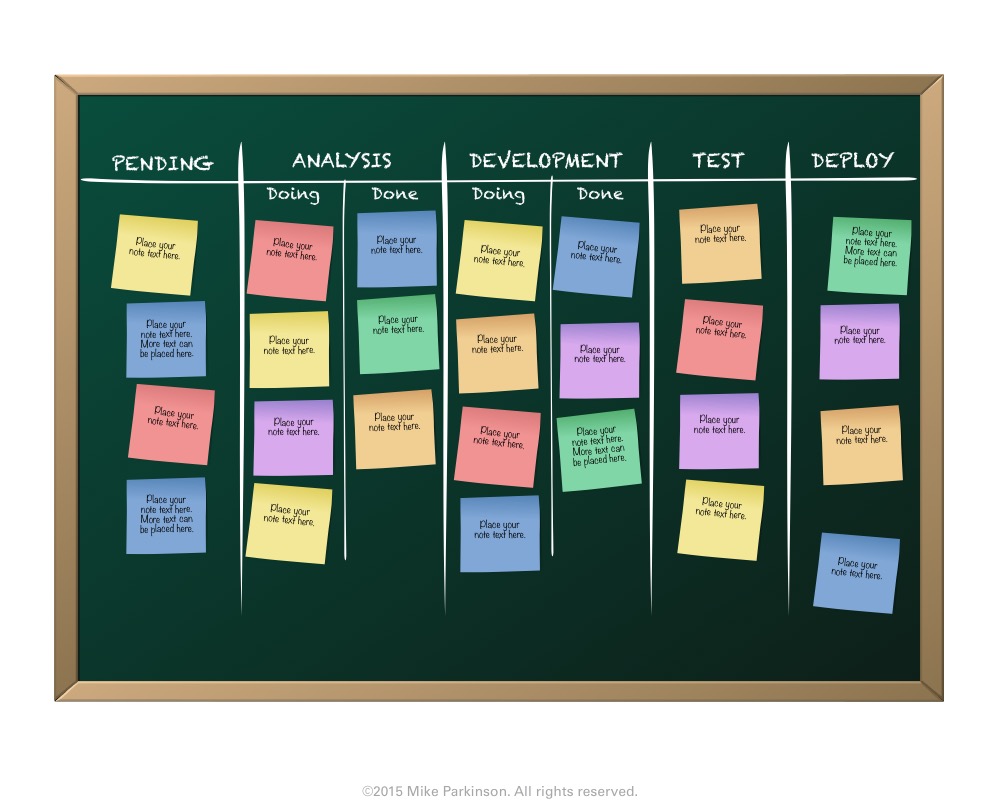
Use this Infographic to showcase interconnected information related to a specific topic.
Use this Infographic to showcase interconnected information related to a specific topic.