Graphic Description
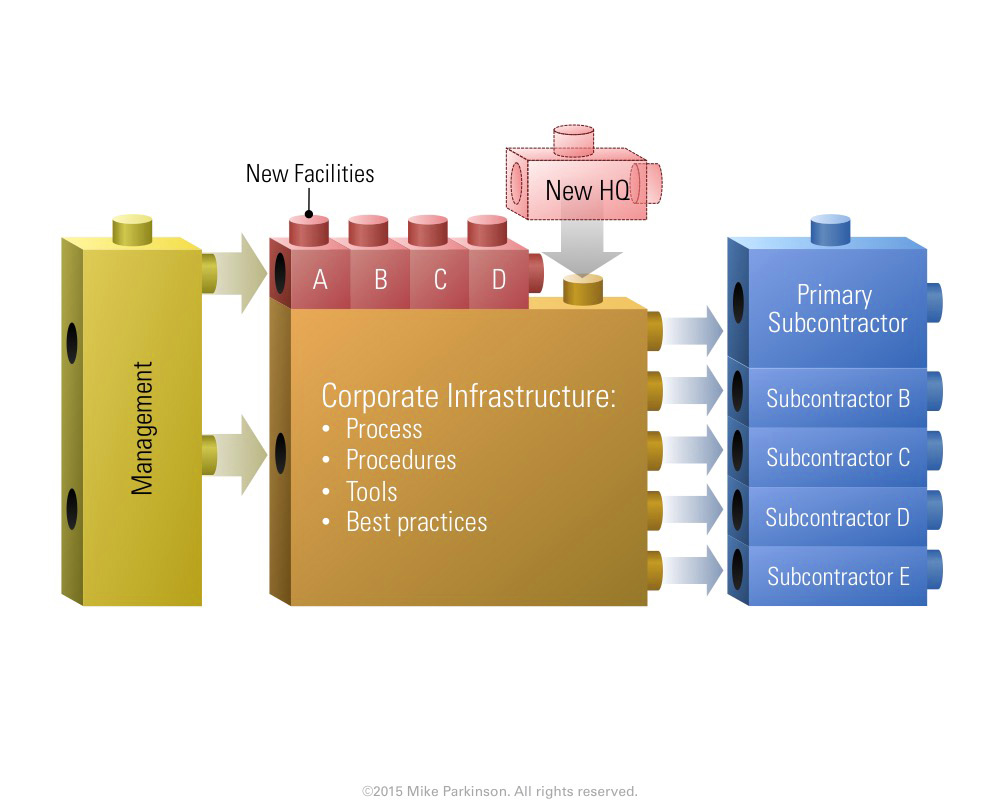
Use this Peg Graphic to show interconnectivity of entities or ideas to create a unified whole (think “Legos”).

Use this Peg Graphic to show interconnectivity of entities or ideas to create a unified whole (think “Legos”).
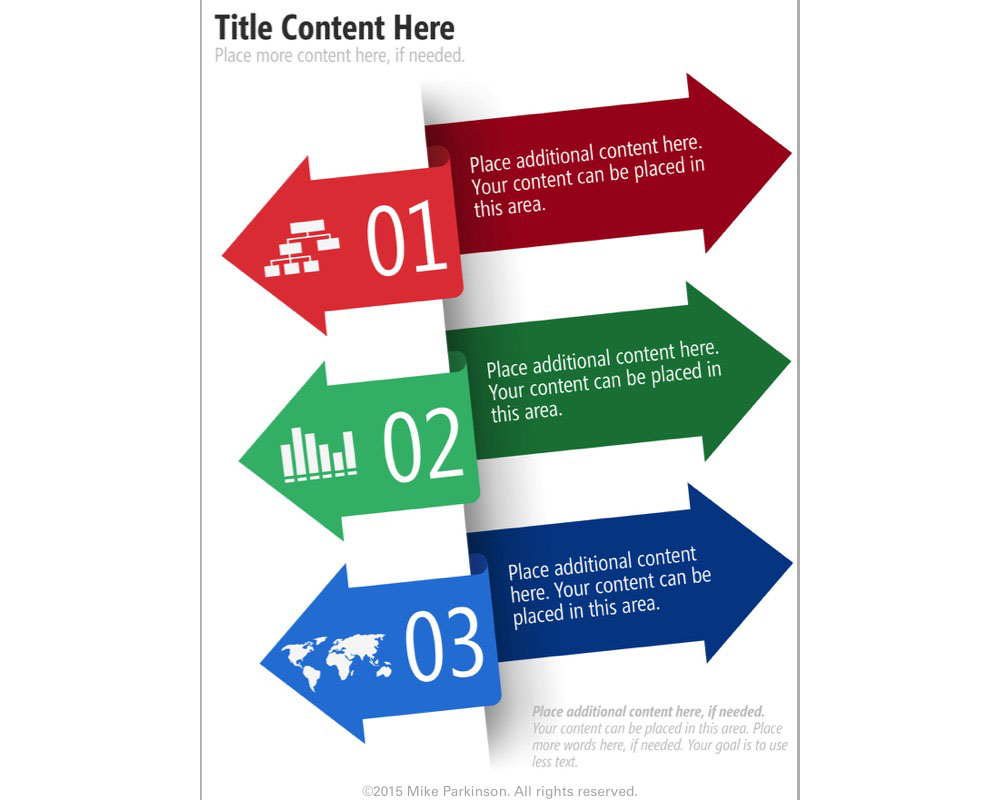
Use these Icons in Infographics or other graphic types to dynamically show movement and transition to a future state.
Use this Infographic to share quantitative data related to a specific topic.

Use this Hexagonal Stacked Graphic to depict hierarchy, arrangement, structure, and/or relationship of a group of elements (e.g., an organization and…
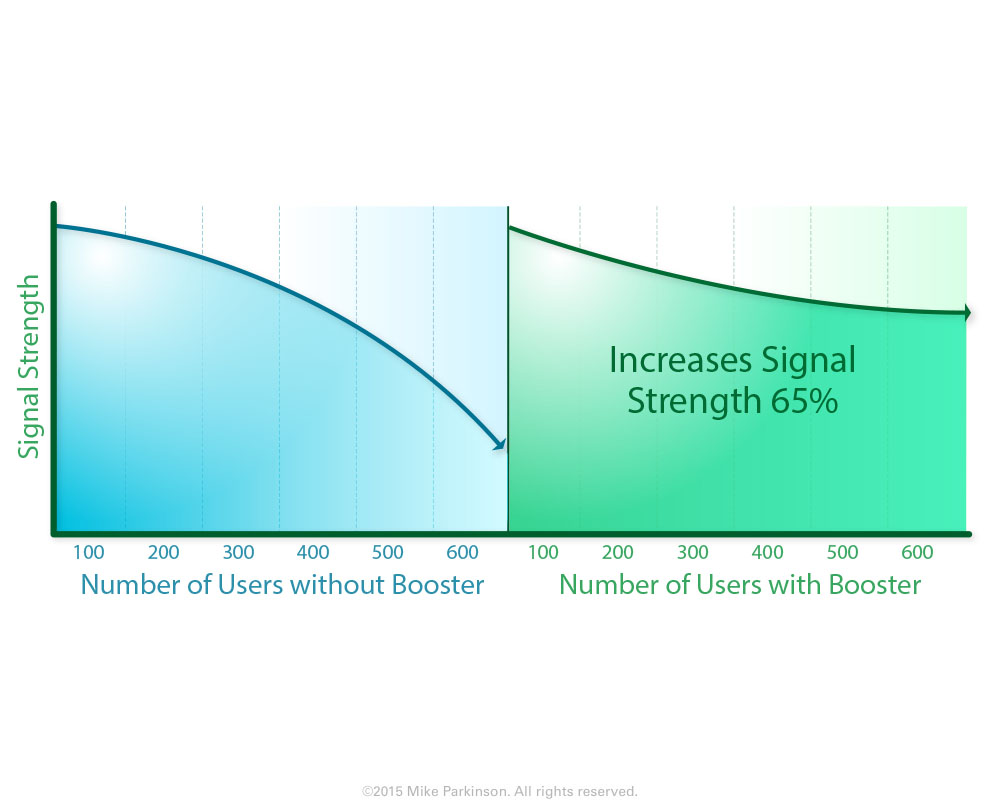
Use this Area Chart to show amounts, values, and time. This graphic is data driven.