Graphic Description
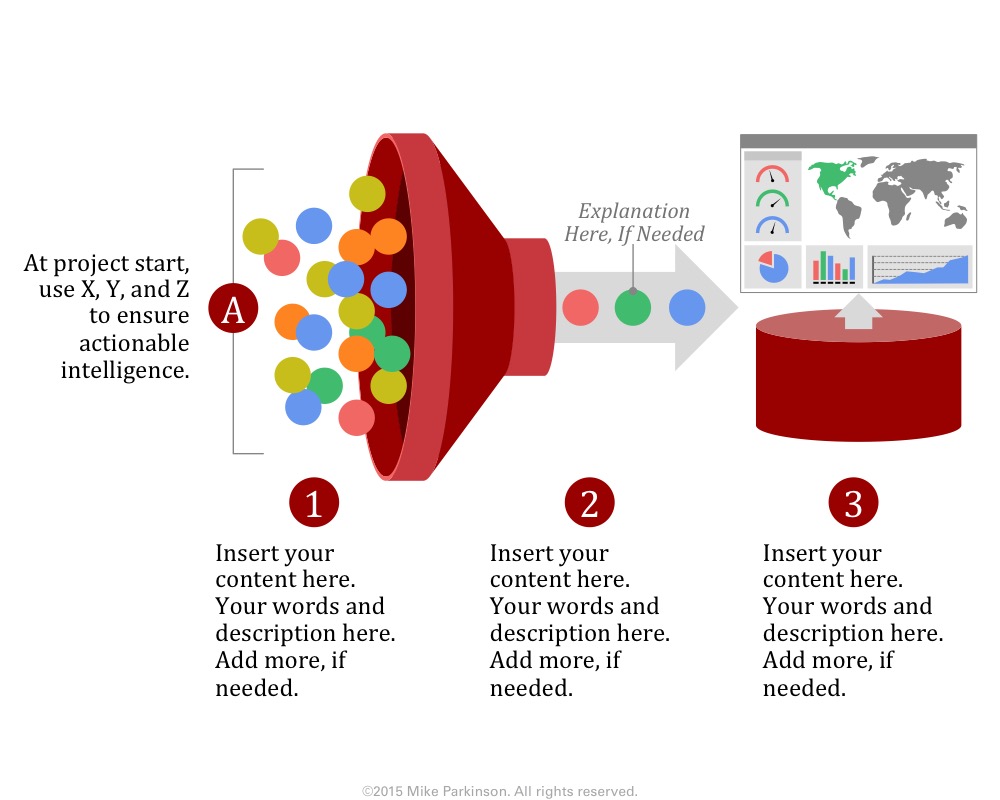
Use this Funnel Graphic as a metaphor showing the passing of elements through a conduit (the funnel) resulting in the effective allocation, consolidation, and/or organization of those elements.

Use this Funnel Graphic as a metaphor showing the passing of elements through a conduit (the funnel) resulting in the effective allocation, consolidation, and/or organization of those elements.

Use this Bar Chart to show amounts, values, and time.

Use this Hexagonal Stacked Graphic to depict hierarchy, arrangement, structure, and/or relationship of a group of elements (e.g., an organization and…

Use this Venn Diagram to show the relationship and/or synergy of disparate elements through the overlap of those elements.
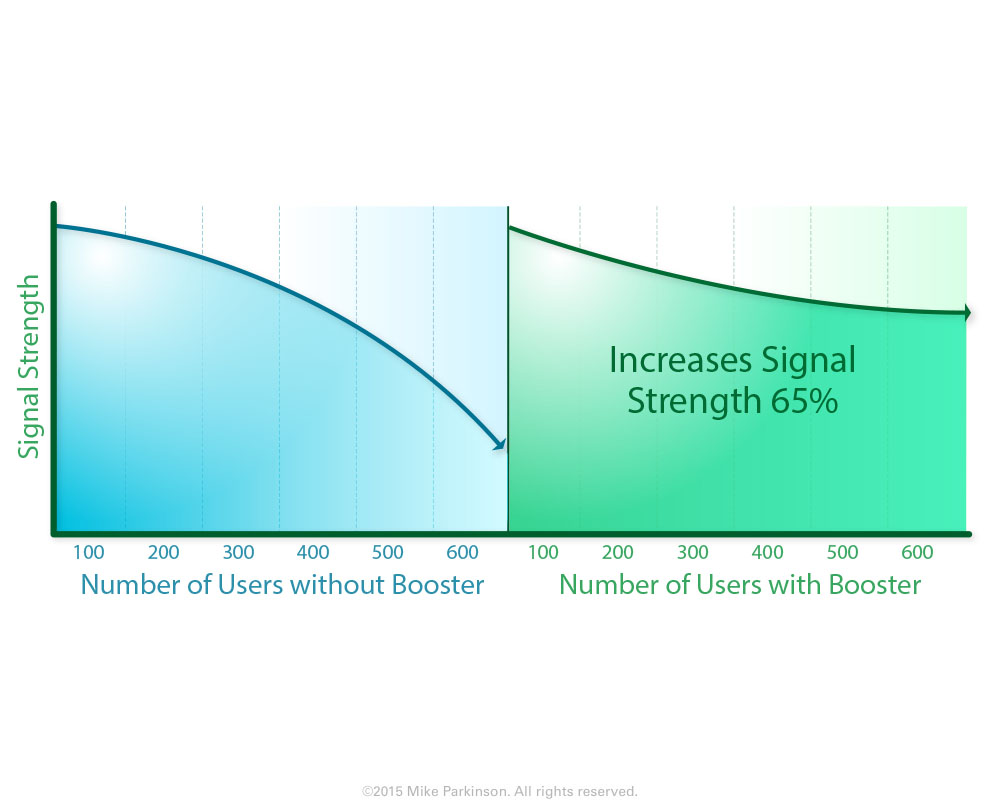
Use this Area Chart to show amounts, values, and time. This graphic is data driven.