Graphic Description
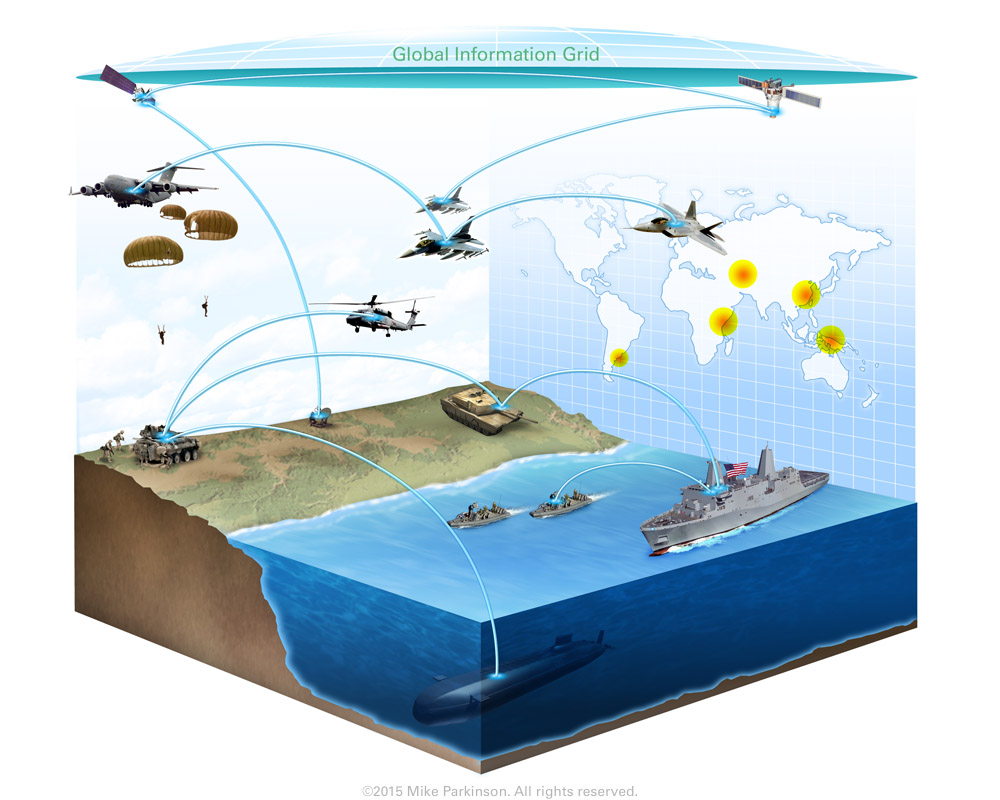
Use this “battle space” Cutaway Diagram to show communication and alignment between forces. Elements are raster with transparent backgrounds. Lines are vector.

Use this “battle space” Cutaway Diagram to show communication and alignment between forces. Elements are raster with transparent backgrounds. Lines are vector.
Use these Icons in Infographics or other graphic types to dynamically show movement and transition to a future state.

Use this Funnel Graphic as a metaphor showing the passing of elements through a conduit (the funnel) resulting in the…

Use this Infographic to show how elements can nourish your ideas and help them fruit.

Use this Hexagonal Stacked Graphic to depict hierarchy, arrangement, structure, and/or relationship of a group of elements (e.g., an organization and…