Timeline Graphic 4
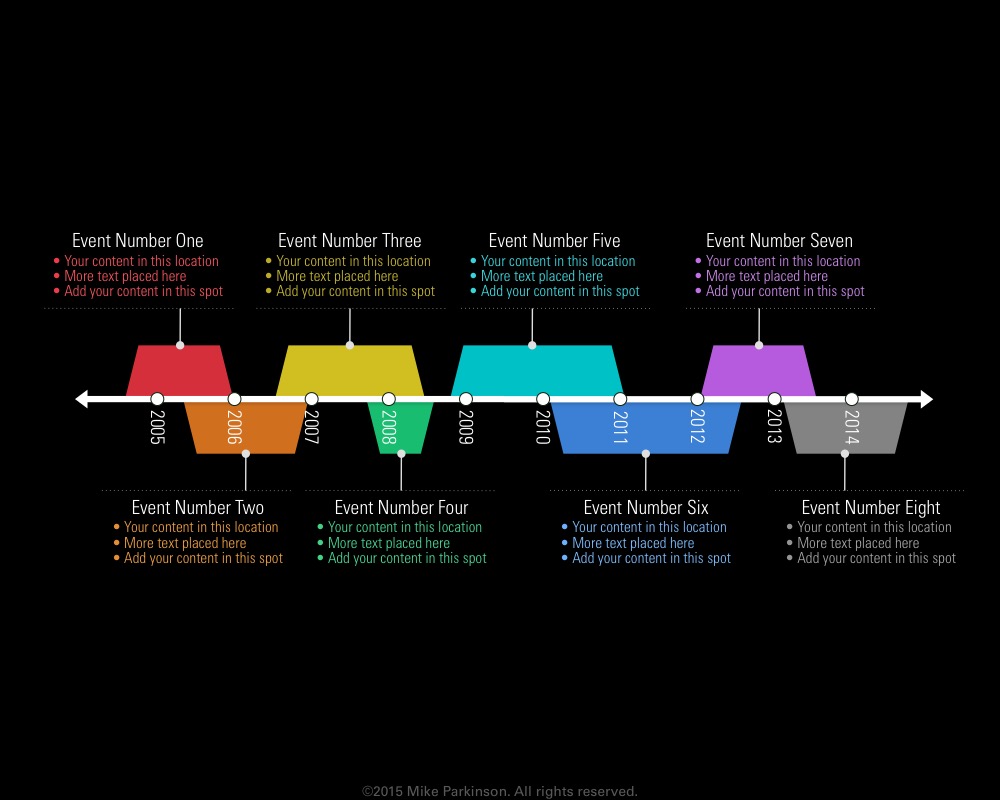
Use this Timeline to show dates for any month. Highlight the month and days and use the blowouts for detail.

Use this Timeline to show dates for any month. Highlight the month and days and use the blowouts for detail.
Use this Timeline to show dates for any month. Highlight the month and days and use the blowouts for detail.

Use this Timeline to show dates for any month. Highlight the month and days and use the blowouts for detail.

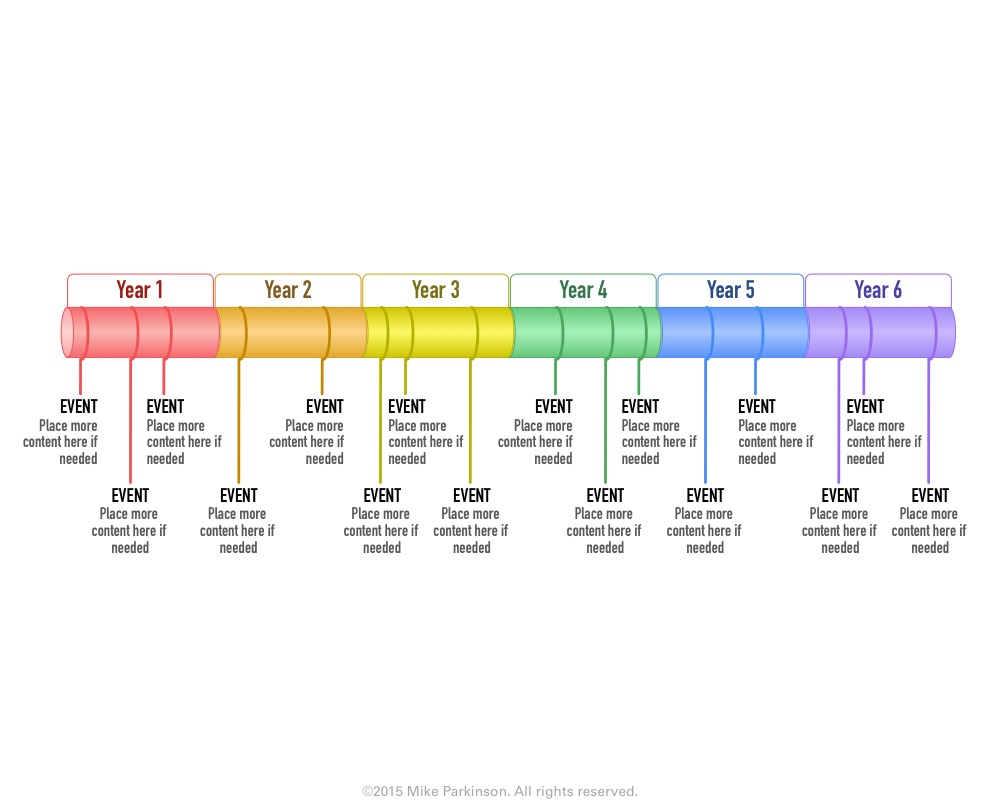
Use this split Timeline to show dates for any month. Highlight the month and days and use the blowouts for…

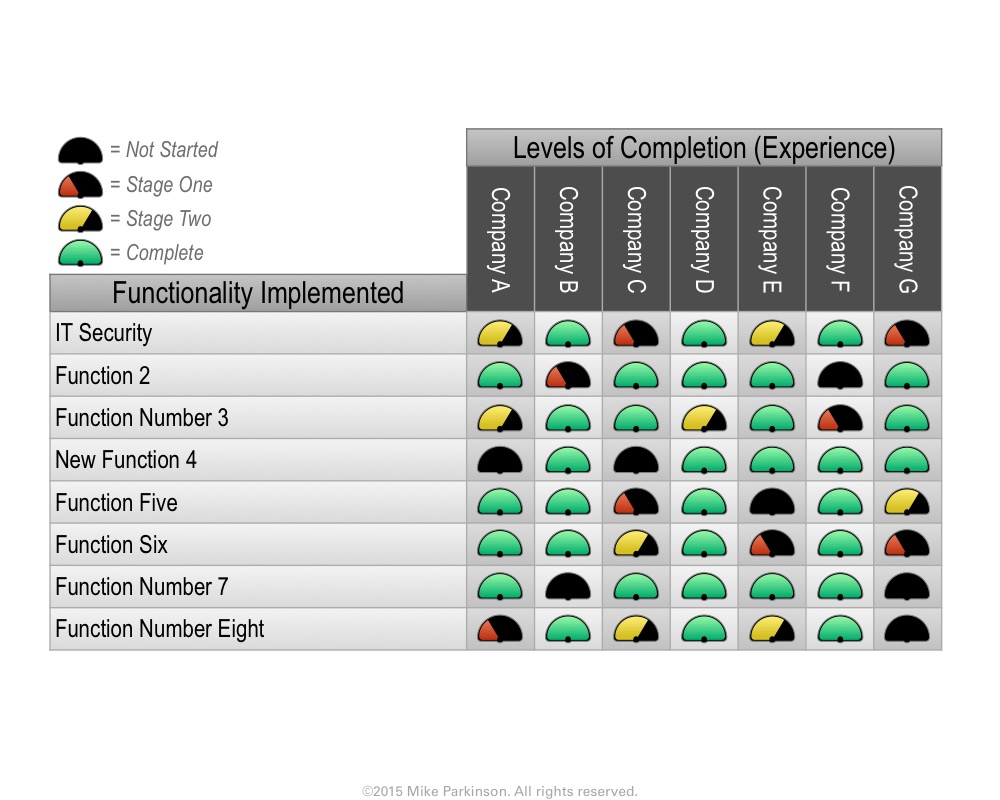
Use this Table graphic to correlate data along multiple axes. This Table graphic uses red, yellow, and green to show…
Use this Table to correlate data along multiple axes.
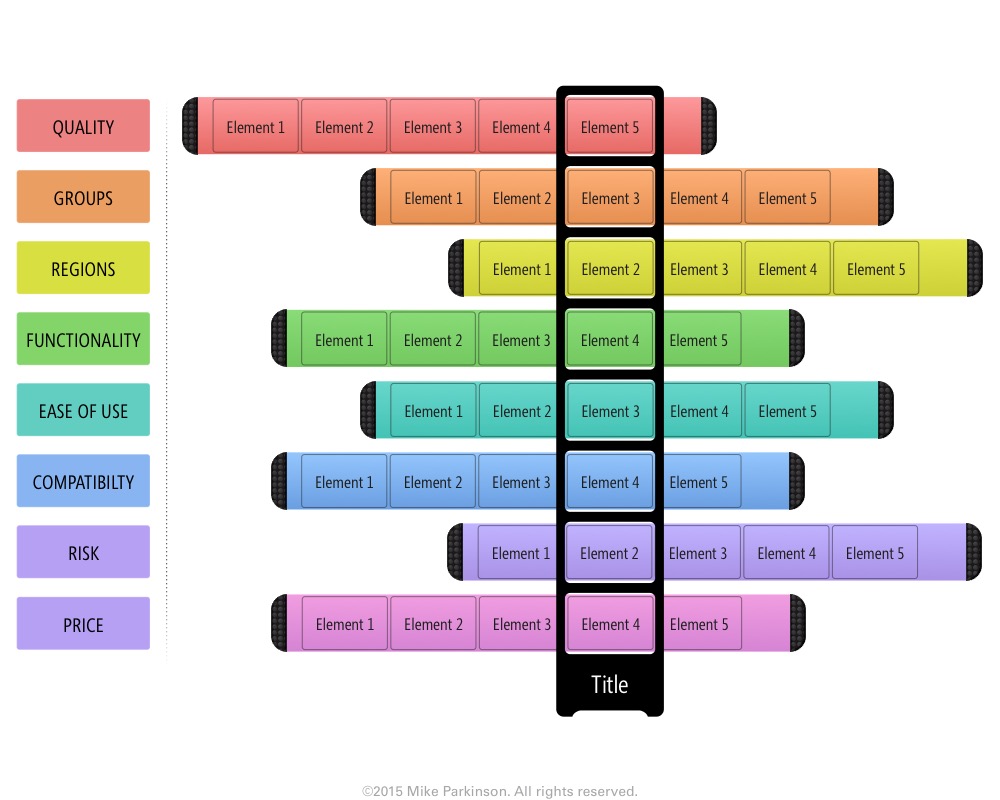
Use this Table to correlate data along multiple axes.
Use this Table to correlate data along multiple axes.
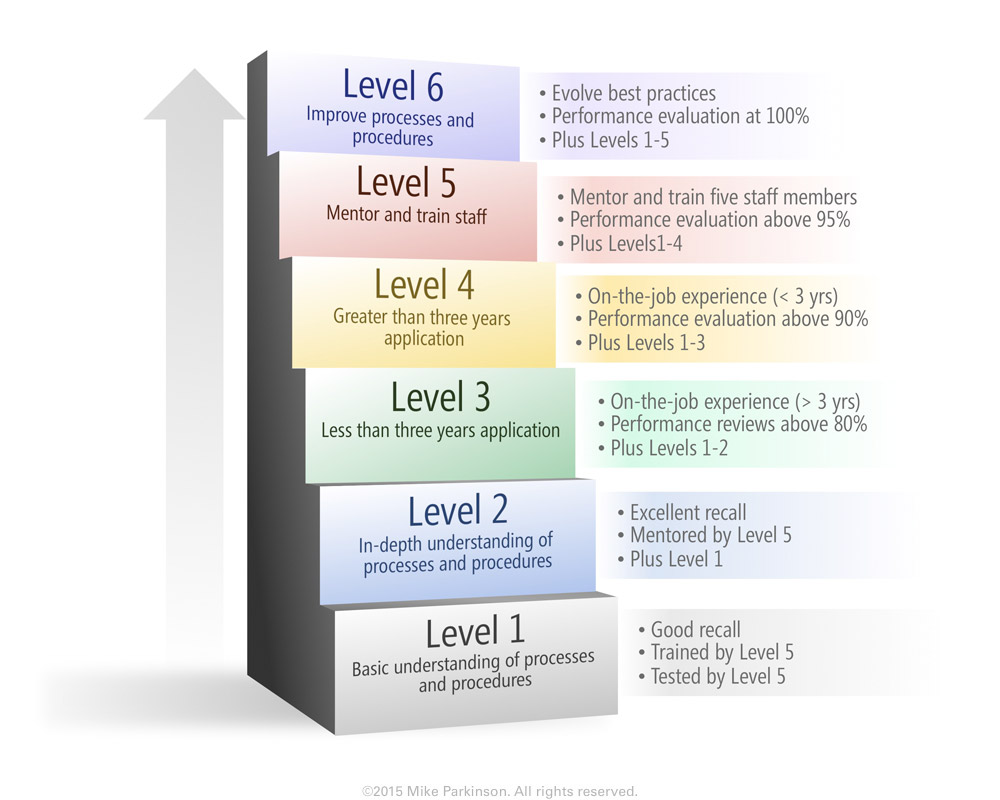
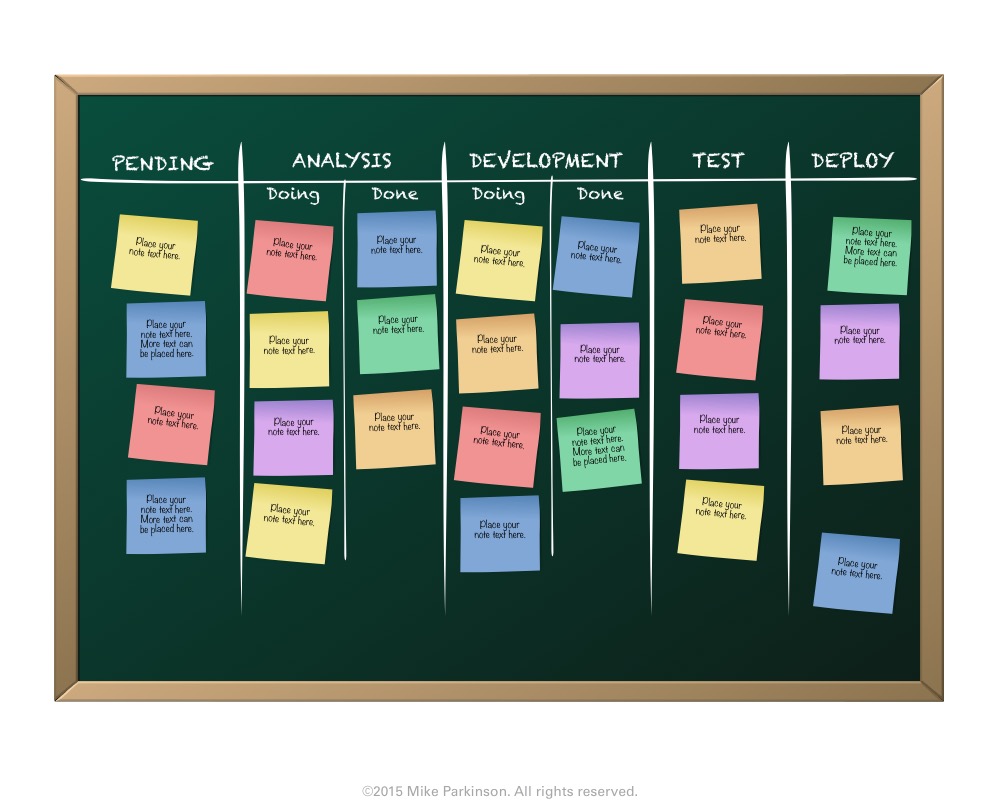
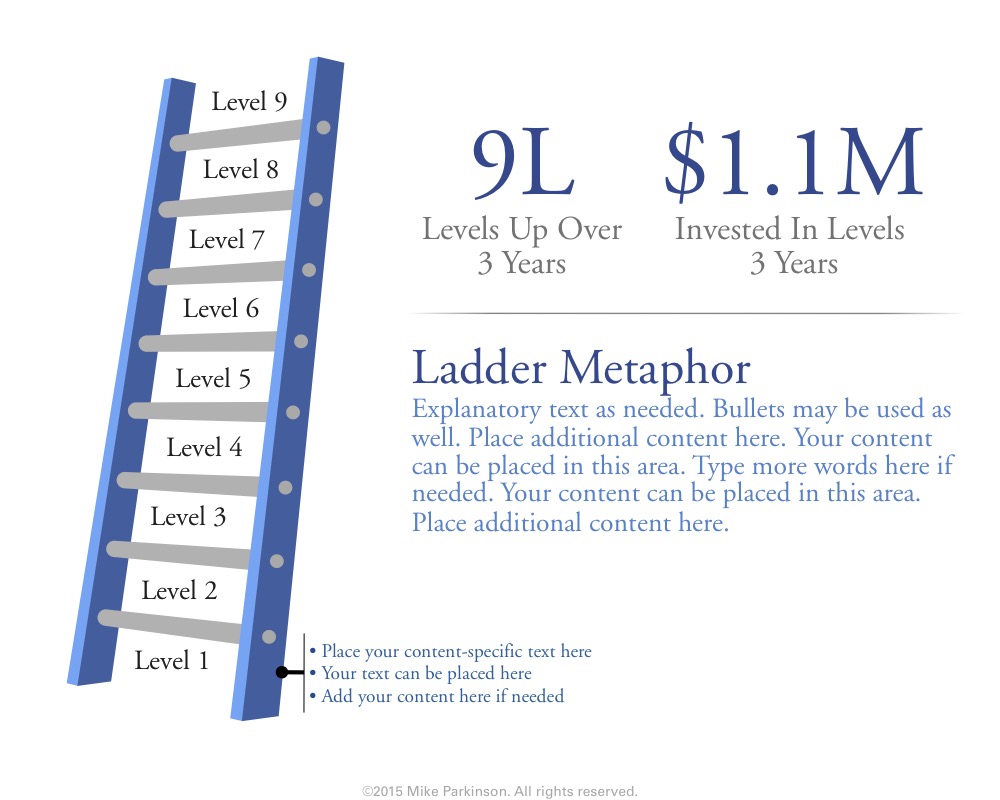
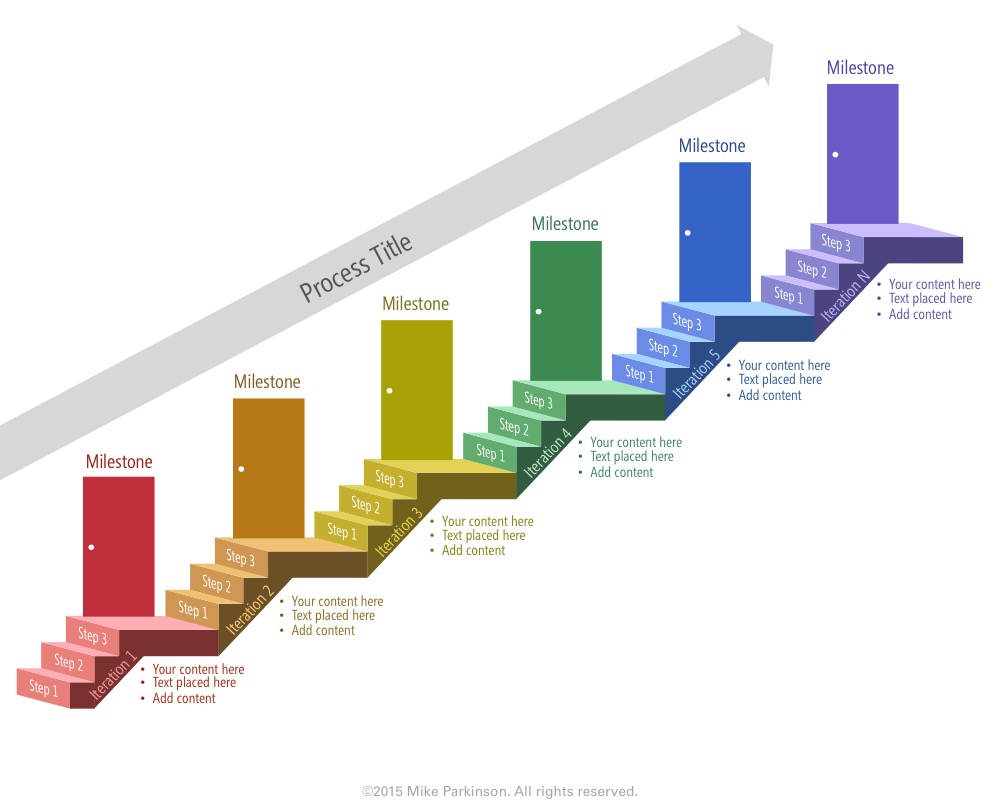
Use this Stair Graphic to show steps in a process, as a metaphor for progress, or to illustrate levels.

Use this Stair Graphic to show steps in a process, as a metaphor for progress, or to illustrate levels.
Use this Stair Graphic to show steps in a process, as a metaphor for progress, or to illustrate levels.
Use this Stair Graphic to show steps in a process, as a metaphor for progress, or to illustrate levels.