Graphic Description
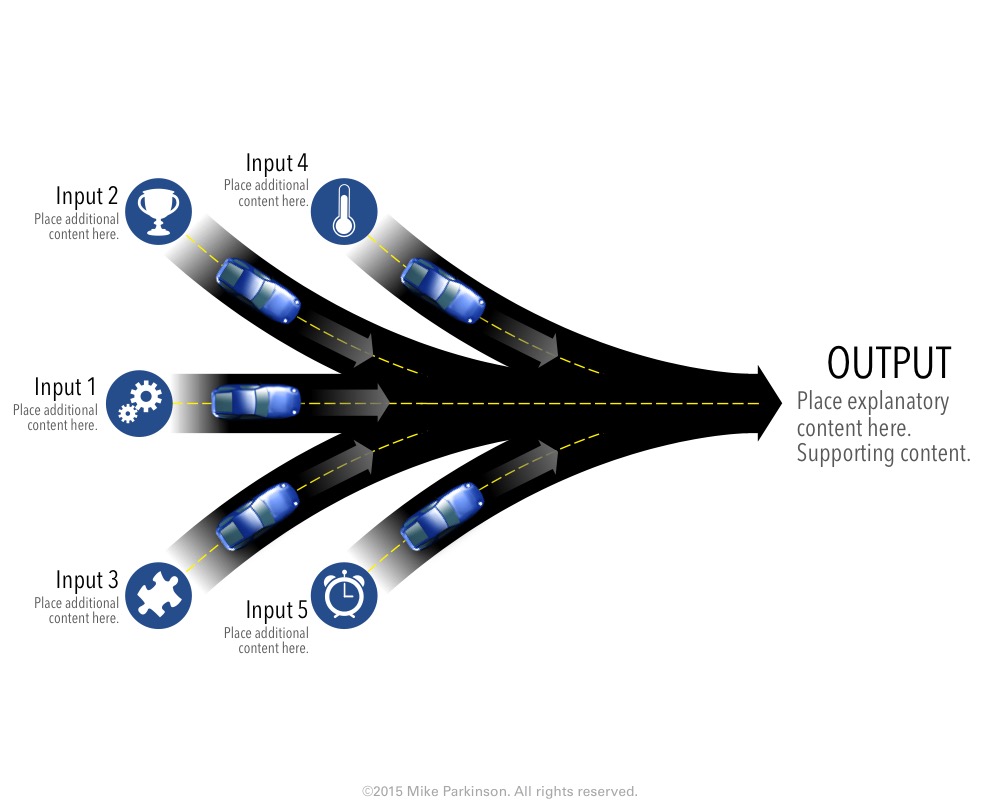
Use this Road Graphic as a metaphor to depict the path between the “as is” or “before” state to the “to be” or “after” state. (This graphic is on a slide background that has a 16:9 ratio. It can be sized down if needed.)

Use this Road Graphic as a metaphor to depict the path between the “as is” or “before” state to the “to be” or “after” state. (This graphic is on a slide background that has a 16:9 ratio. It can be sized down if needed.)

Use this Funnel Graphic as a metaphor showing the passing of elements through a conduit (the funnel) resulting in the…

Use this Hexagonal Stacked Graphic to depict hierarchy, arrangement, structure, and/or relationship of a group of elements (e.g., an organization and…

Use this Venn Diagram to show the relationship and/or synergy of disparate elements through the overlap of those elements.
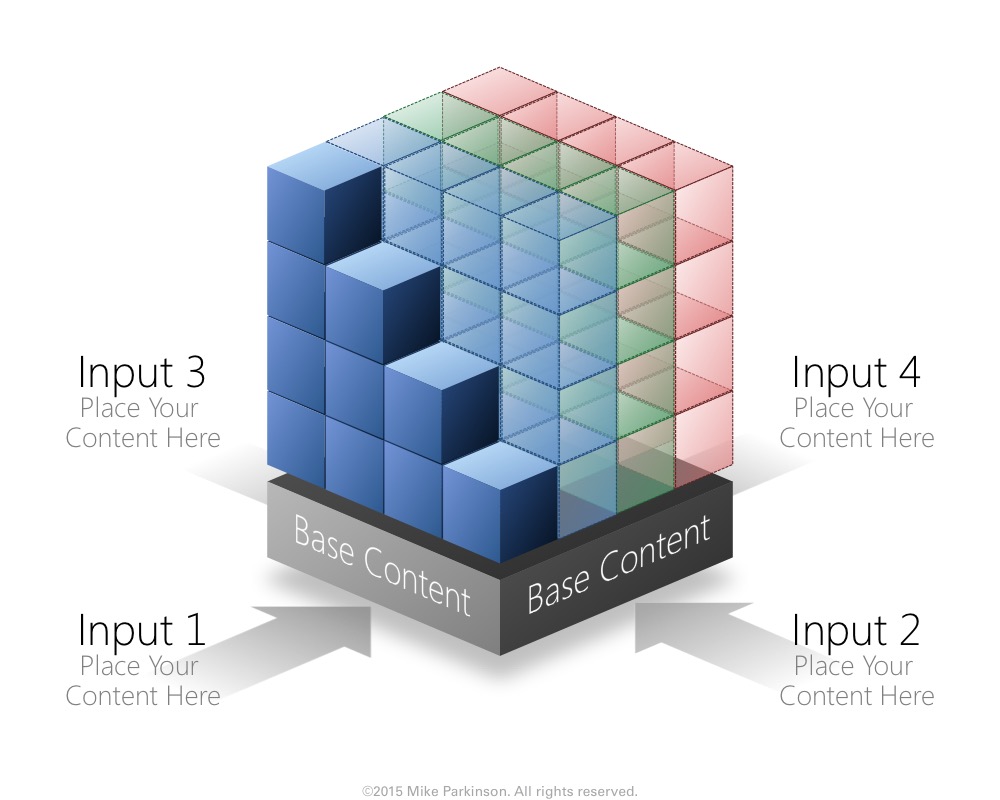
Use this Block graphic to show how elements work together.