Renewed Workshop: Build Stunning PowerPoint Templates & Graphics That Work! March 22, 2024 8 am…

I was recently interviewed by the folks over at BrightCarbon, a specialist presentation design agency. We talked about all things PowerPoint and graphic design, and how I ended up doing what I do! Check out the interview on their blog.
In the meantime, in exchange, they wanted to share some of their words of wisdom with you, so here’s BrightCarbon’s Lizzie with some great how-tos for adding some graphic pop to your presentations.
_________________________________________
Three Ways to Add Some Punch to Your Presentations
Hello readers, many thanks to Mike for letting us hijack his blog for a quick post. We want to take the opportunity to share some of our favorite design tricks in PowerPoint that will help you add a touch of finesse to your slides, and knock your competition out of the water along the way.
So without further ado, here are three ways you can add some punch to your presentations.
Trick #1: The photo highlight
This is one of our absolute favourites. It’s very simple, but creates a really good effect.
1) Start by pulling your picture into PowerPoint. Ctrl+D to duplicate it.
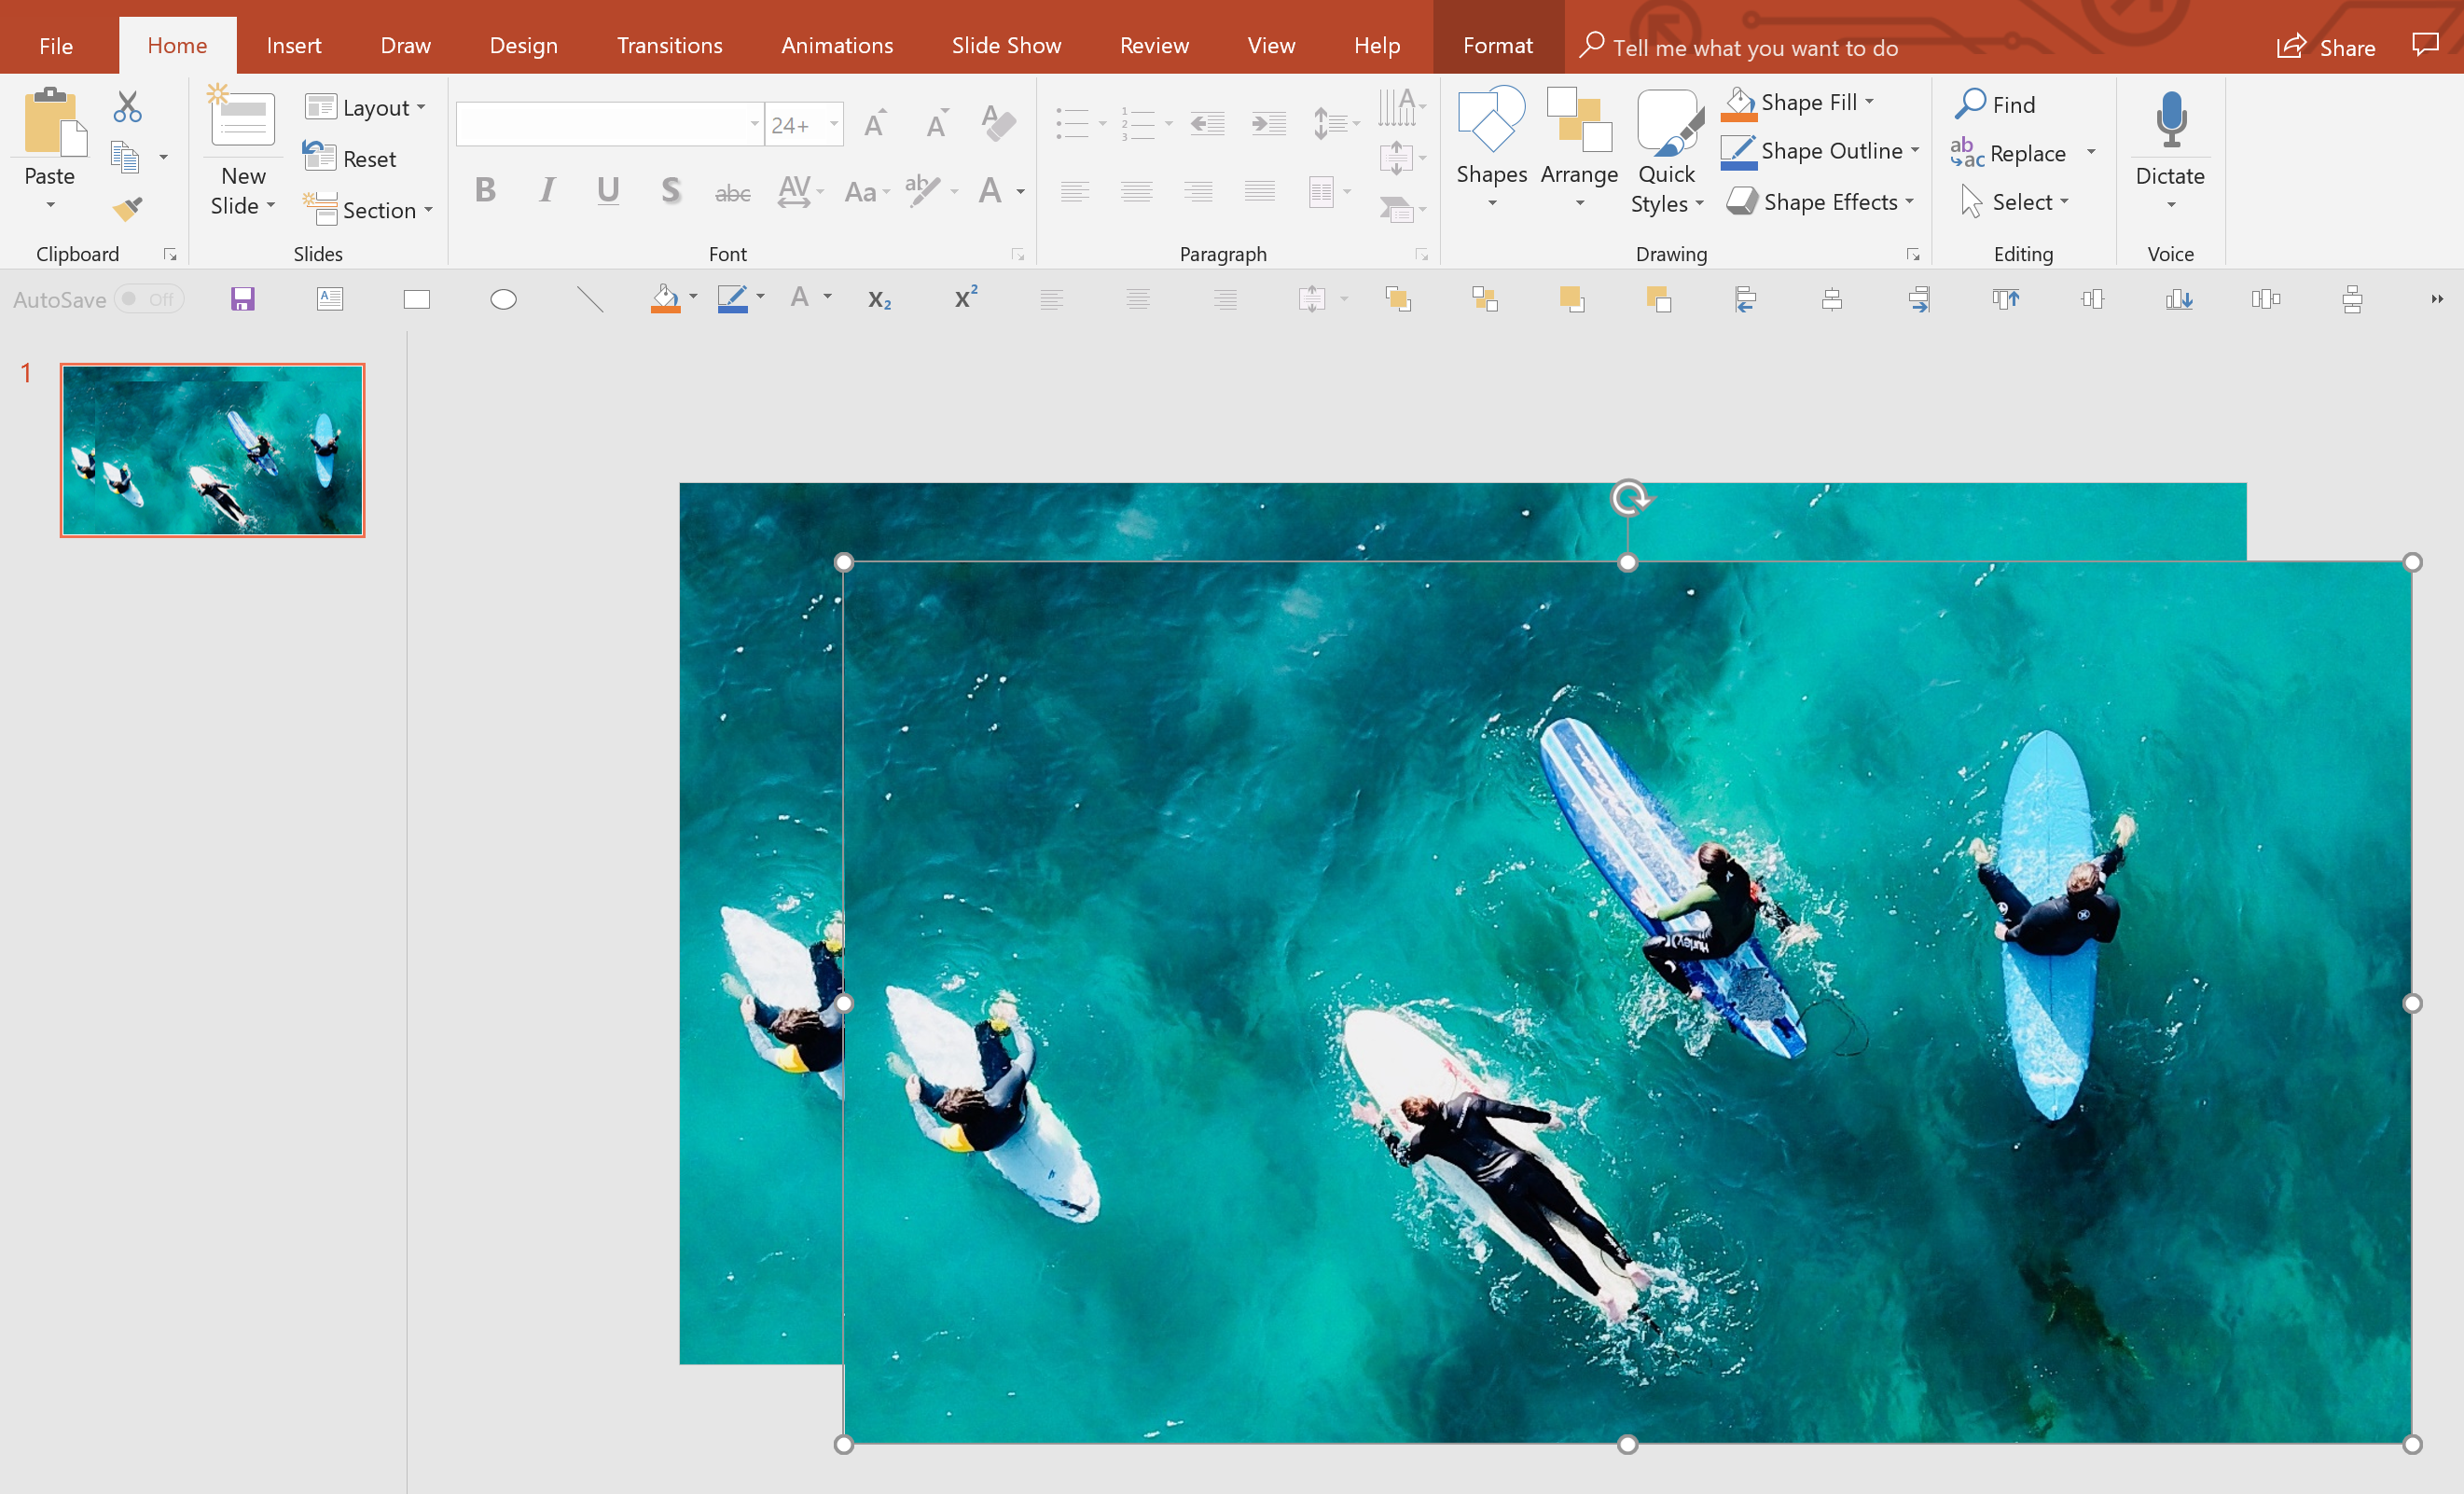
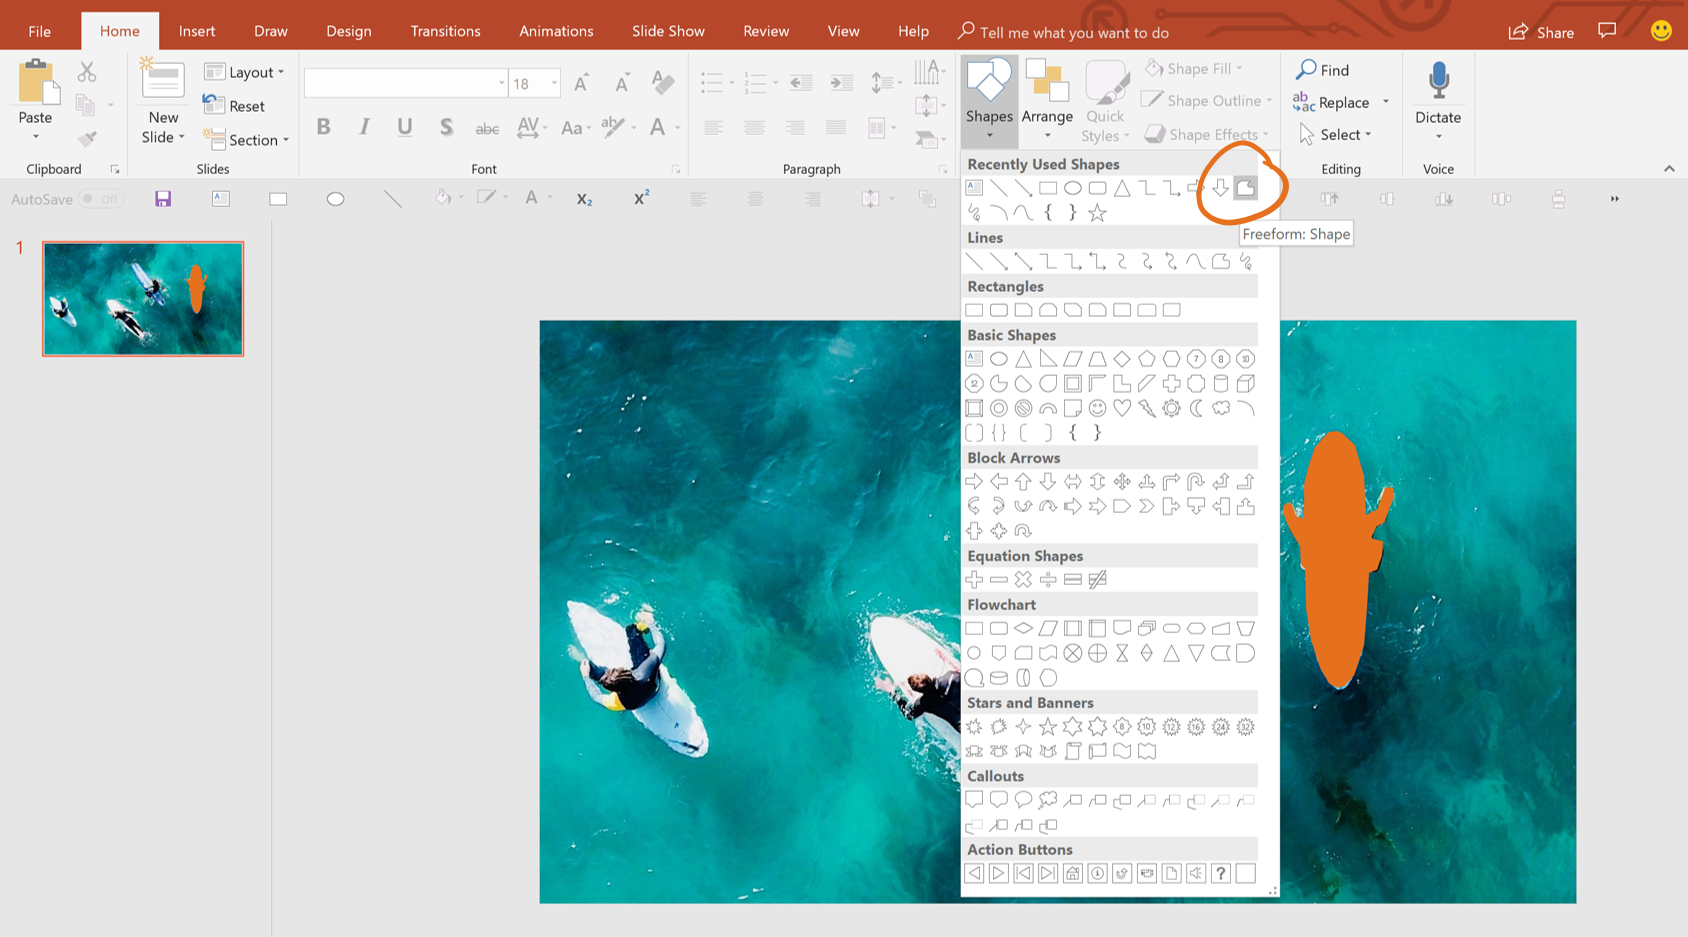
2) Use the freeform tool to draw around the object you want to highlight.
3) Use the shape intersect tool to cut out the object from your photograph. Click the photo, hold down Ctrl, then click your shape.
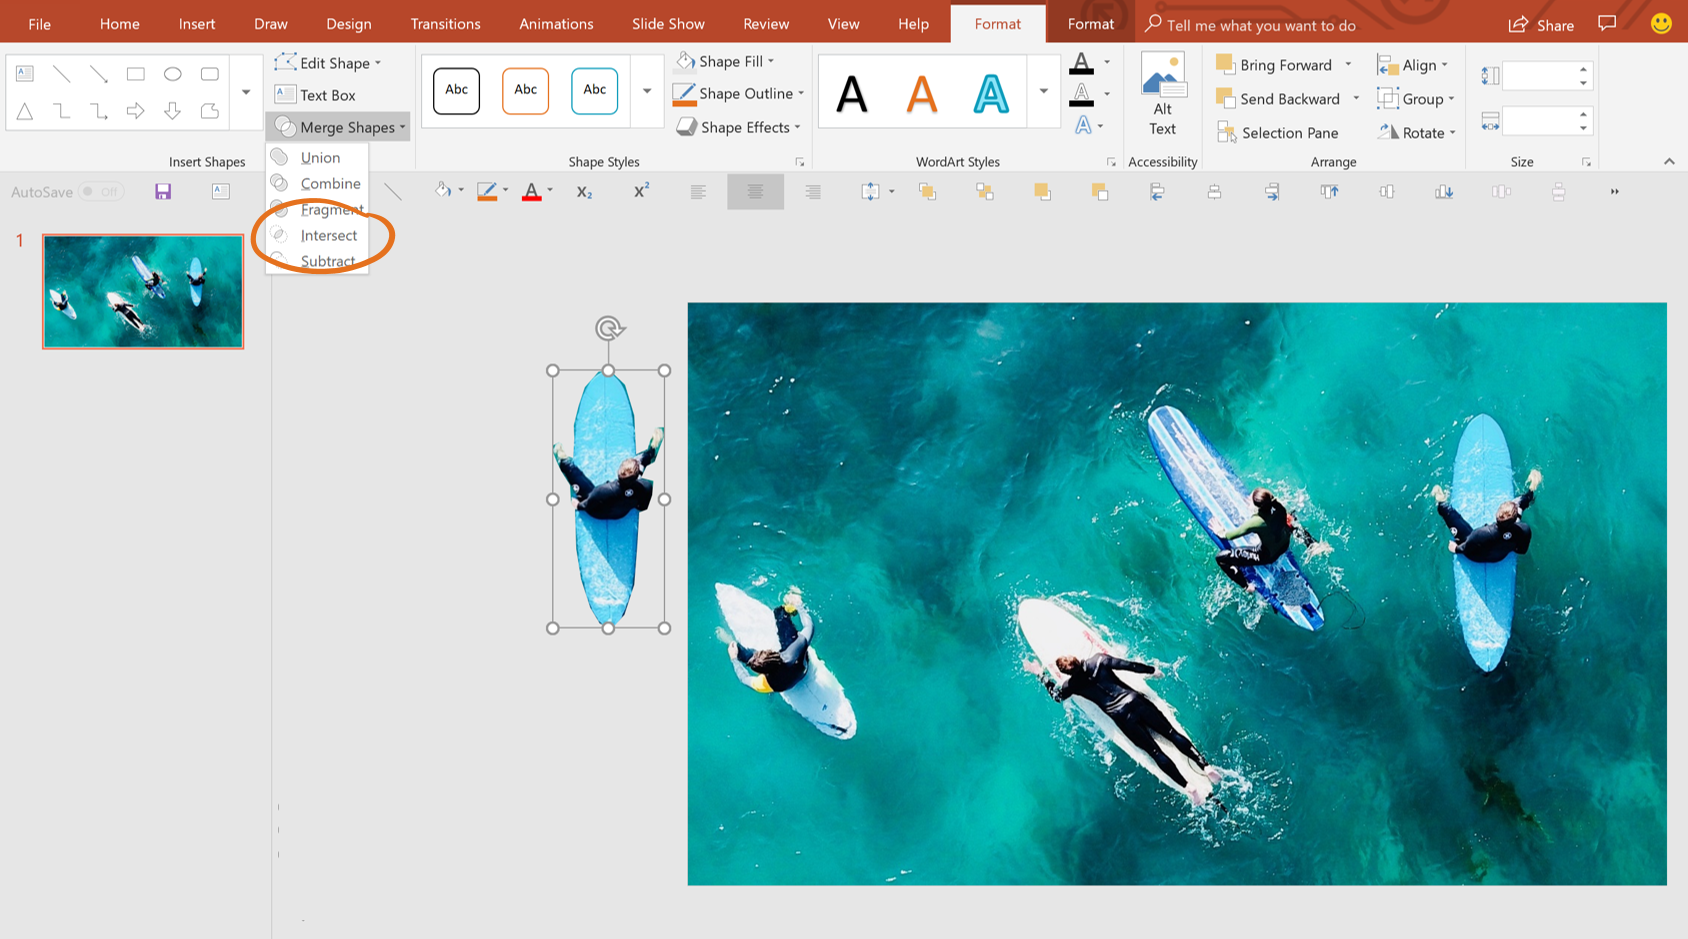
4) Finally, draw two circles, one slightly bigger than the other. Add a slight transparency to the biggest. Now arrange your circles under your object (by bringing your object to front). Highlight complete!
Trick #2: Size matters
Representing data can be really tricky, but often good statistics will be the clincher when it comes to persuading people to buy your product, or take your training on board. This kind of proof point placed into a well-written, well-structured sales presentation, can do your message a whole pile of good (for more information on that, check out our guide to making the ultimate sales presentation).
But that’s only half the battle. The next step is to make sure that your good data is shown off properly with good visuals. Mike has loads of really good examples you can download over here, but here’s a quick DIY you can do in PowerPoint.
1) Draw five circles the same size with a data point in each.
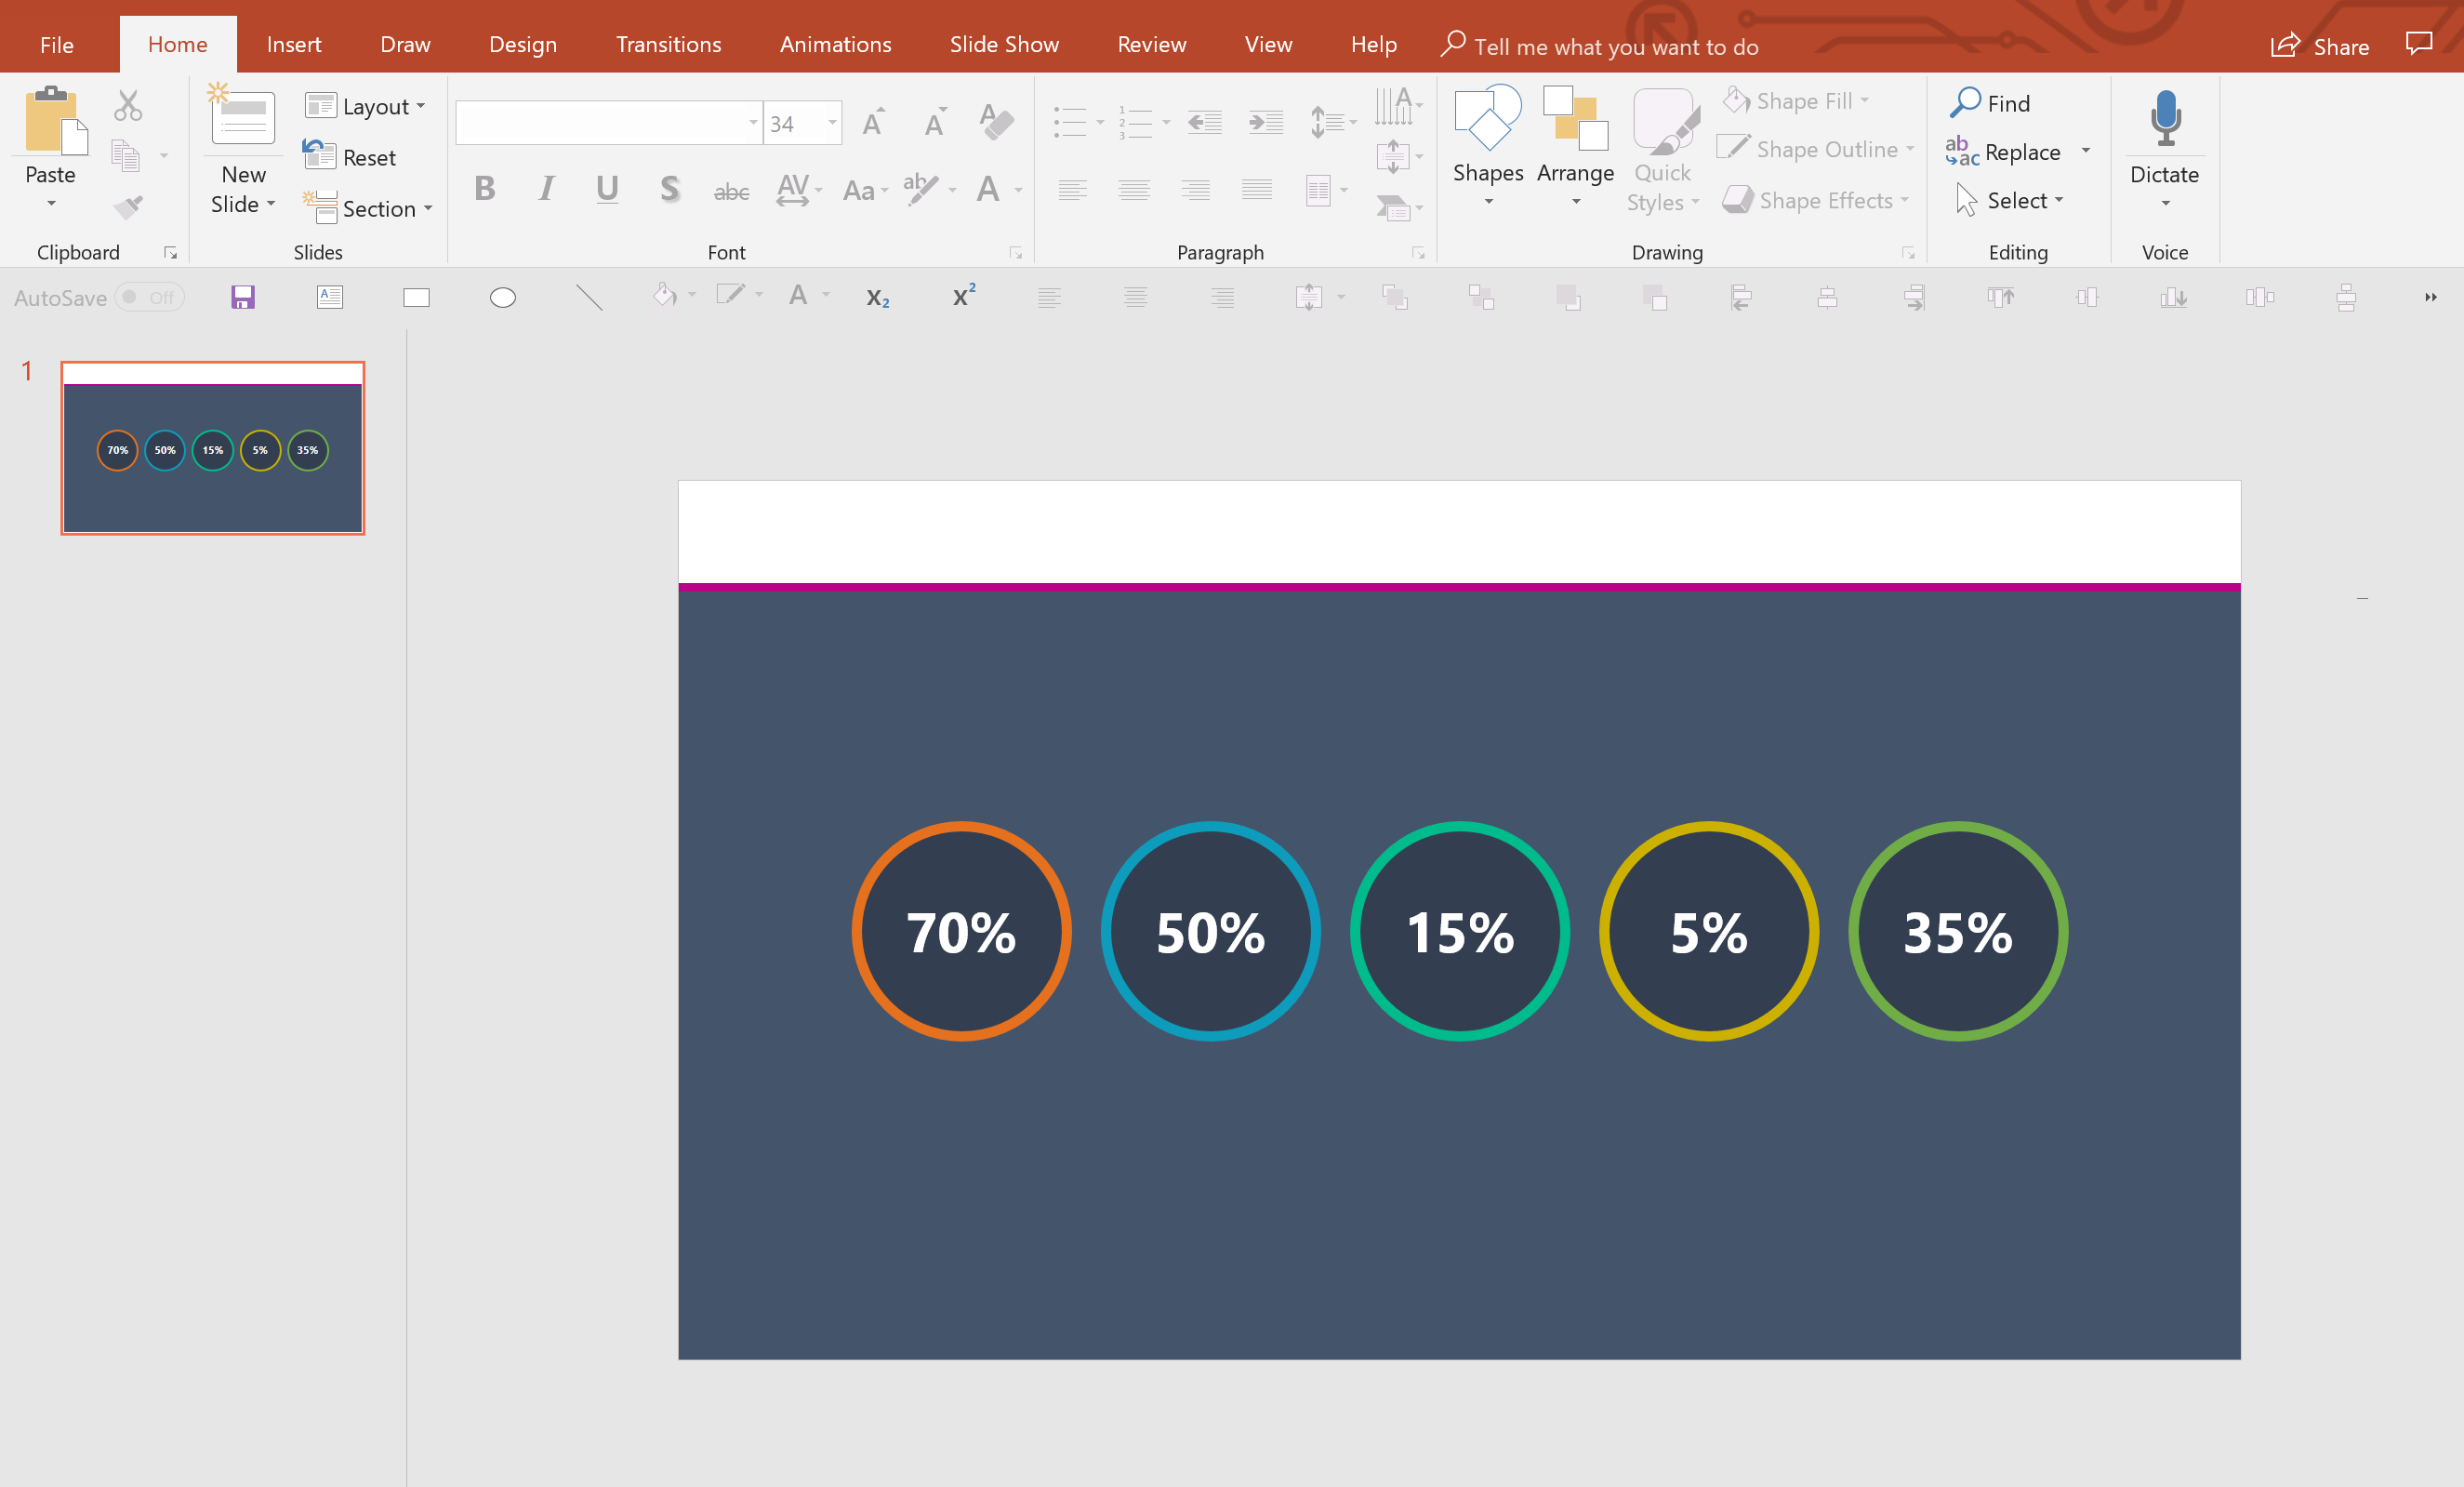
2) Open up the size and position tab and scale each circle to match its percentage.
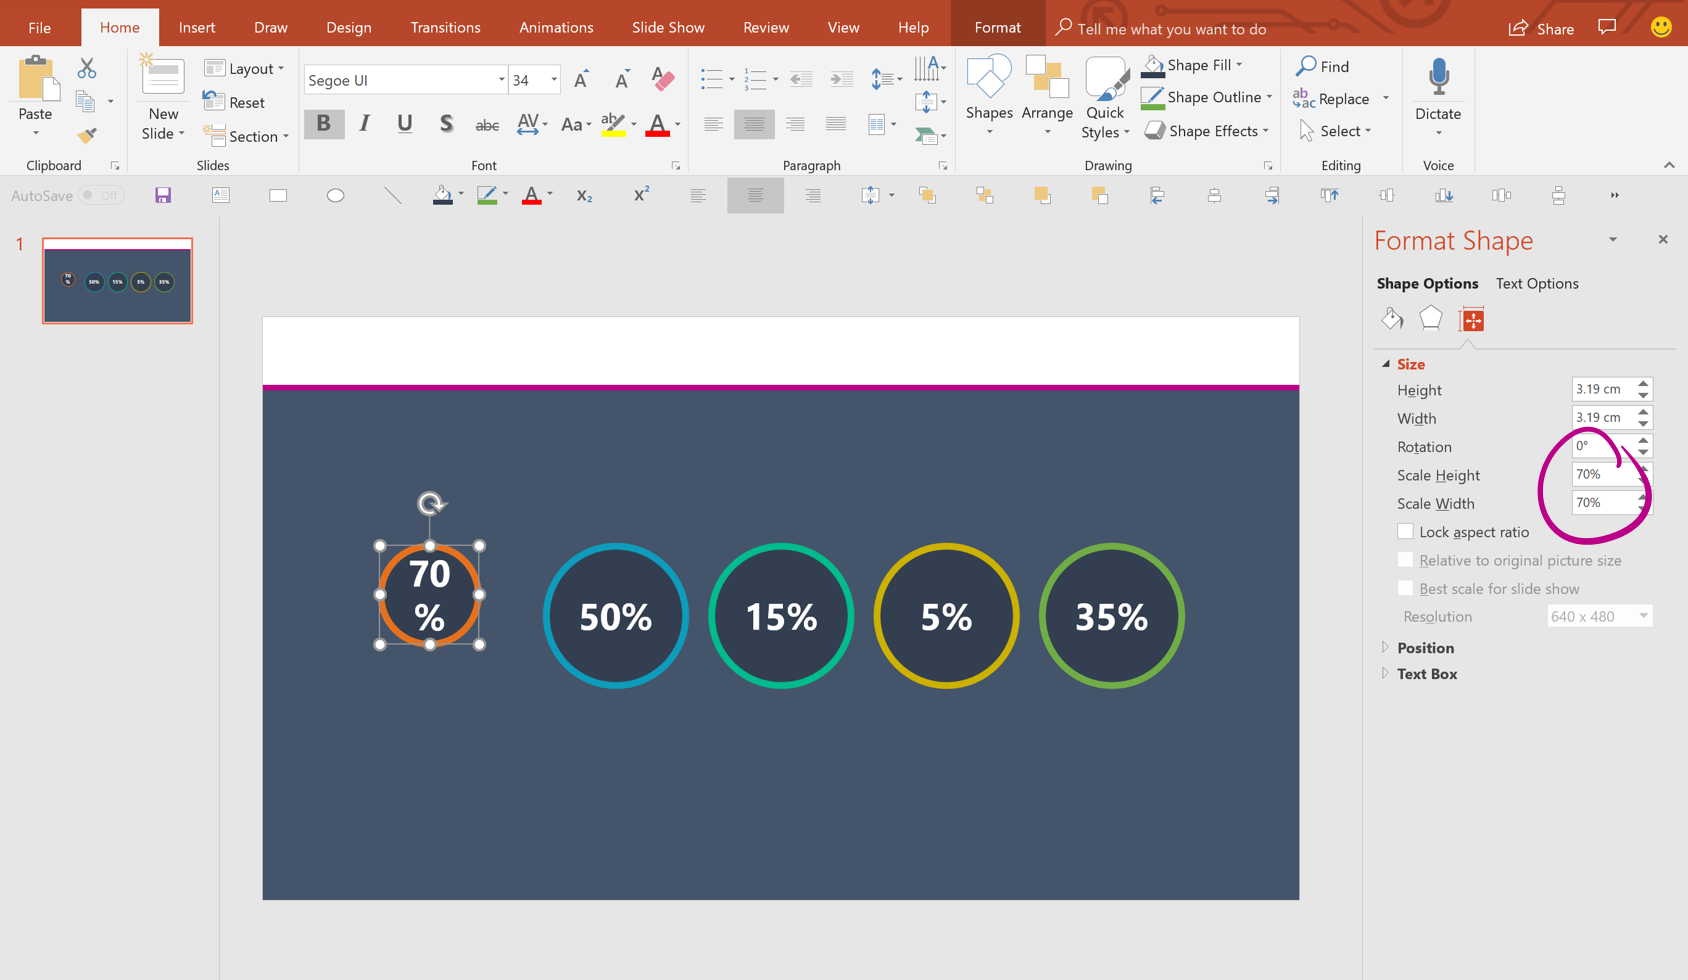
3) Group your shapes and, holding down Shift, resize the group until the shapes are the size you want.
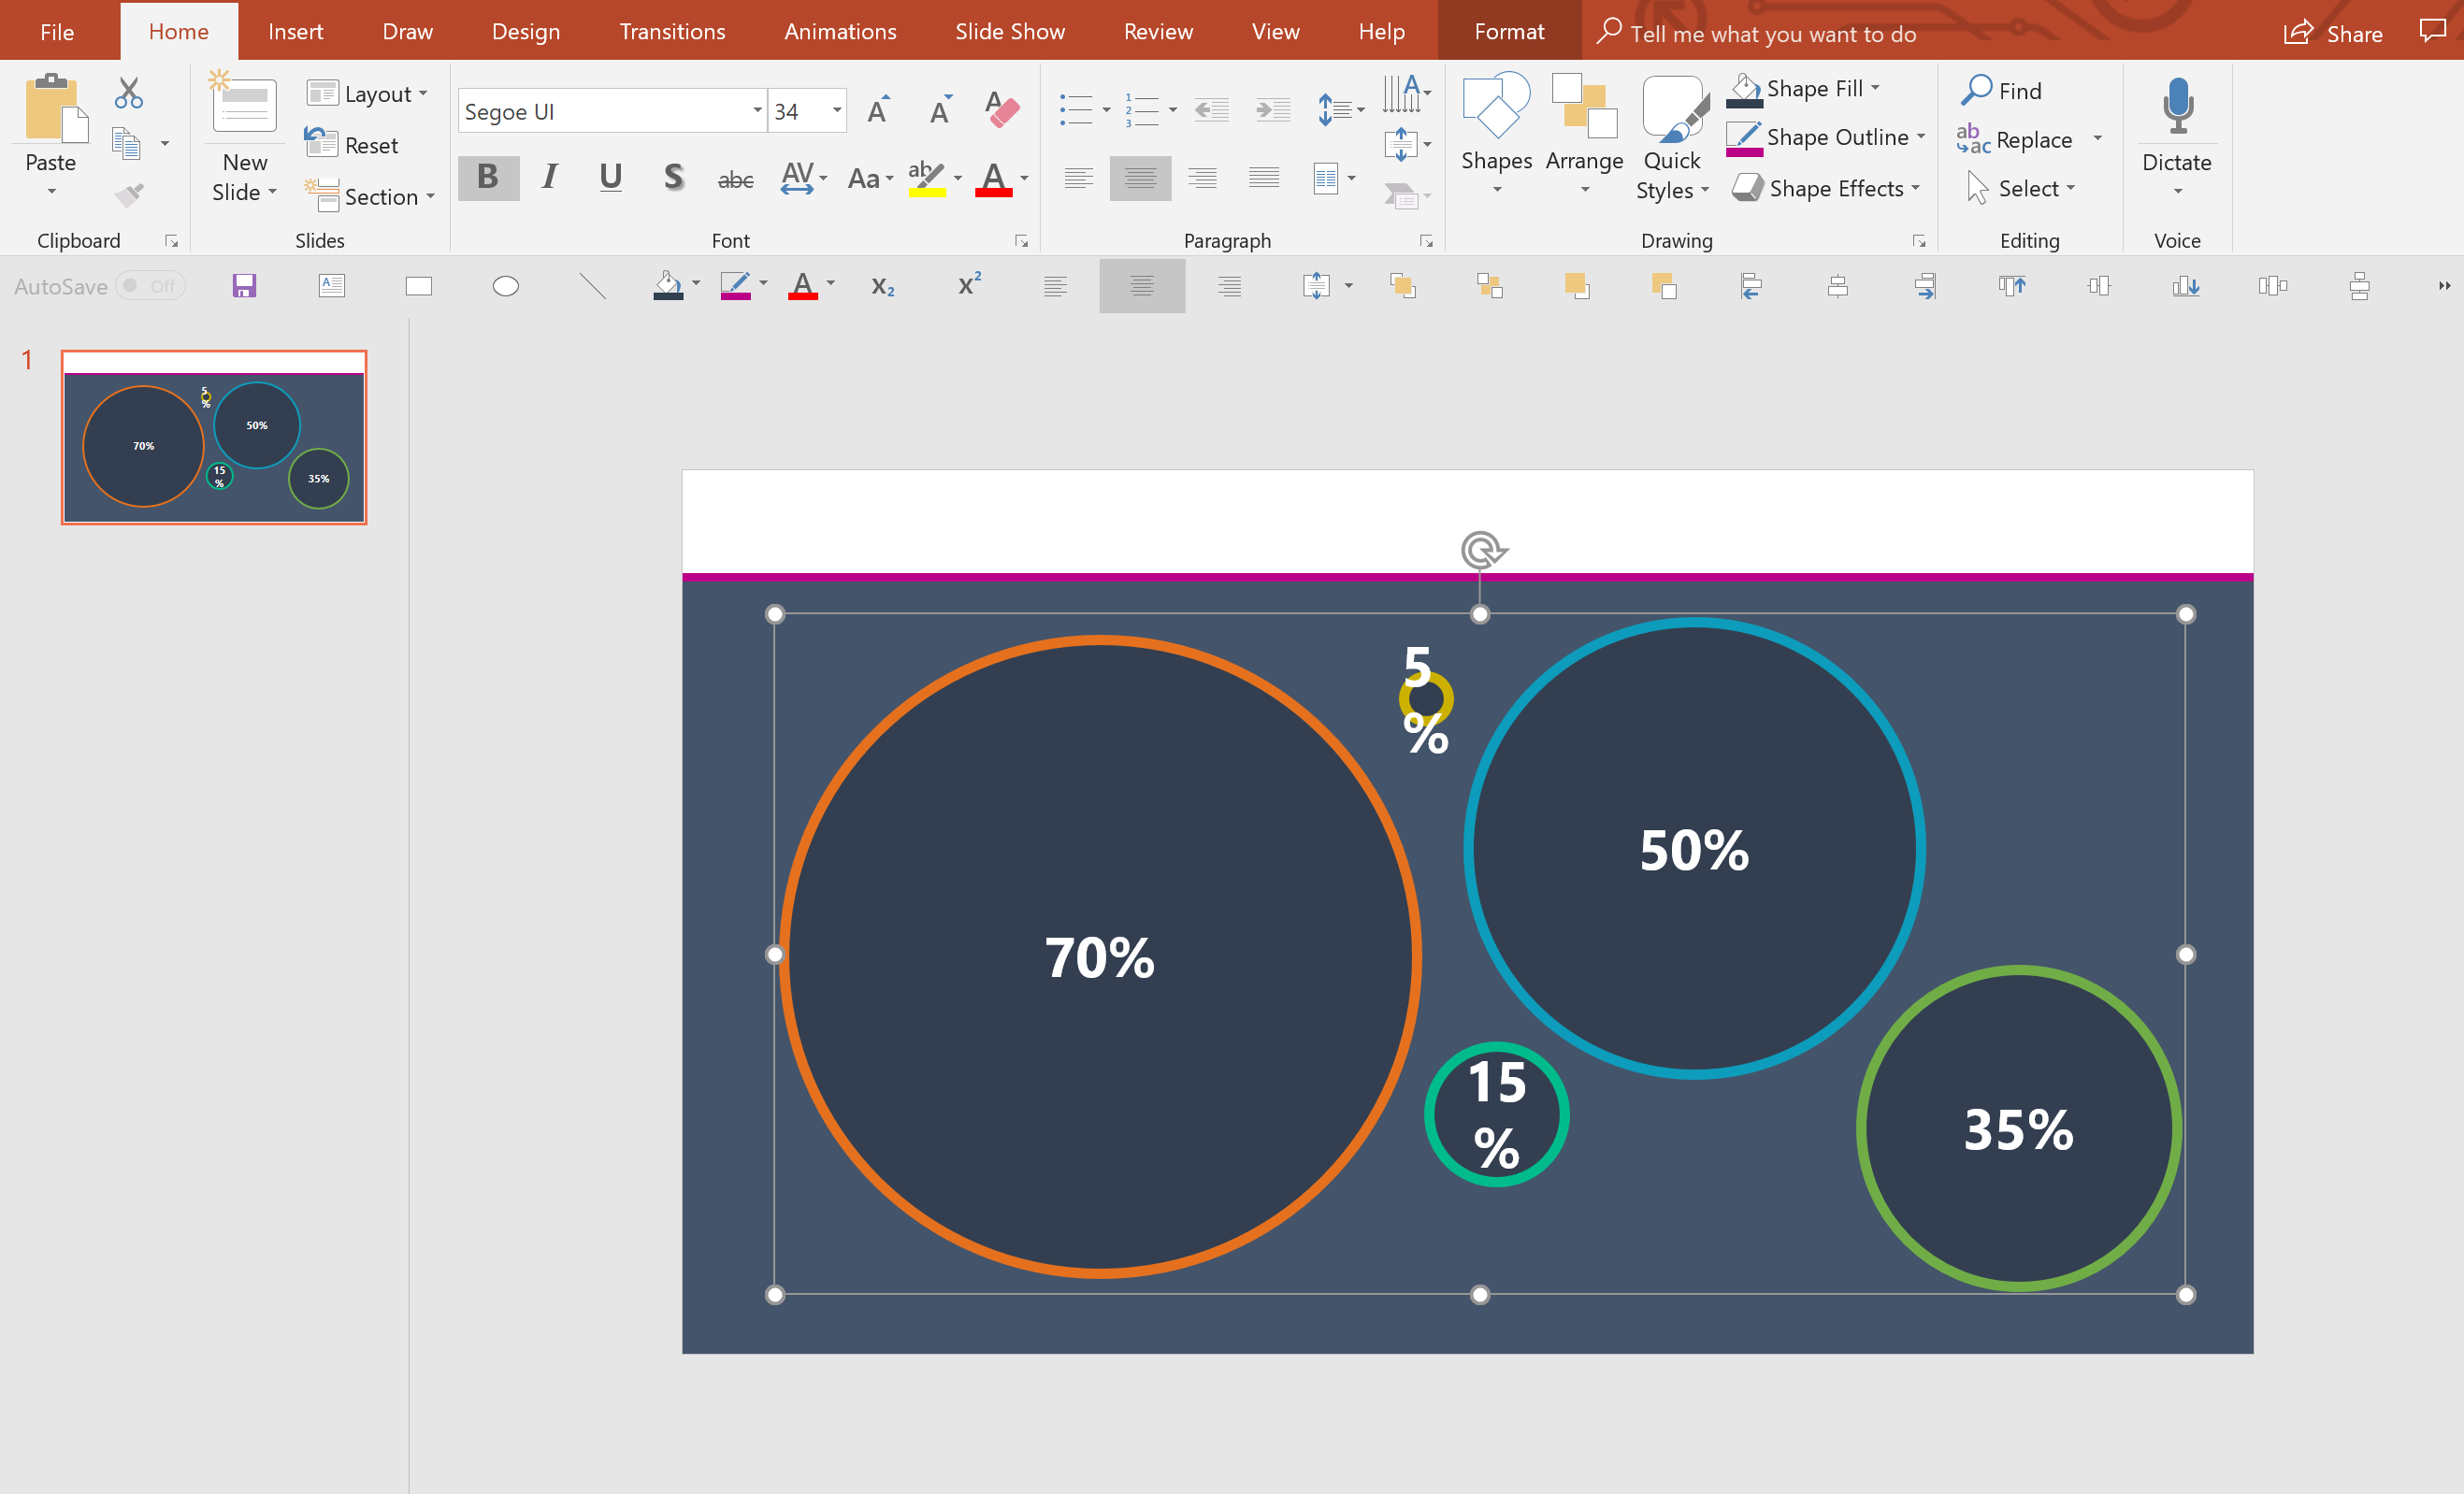
4) Tidy up the layout and alter the size of the text as appropriate.

Trick #3: The focus shift
Being able to zone your audience’s attention in on a particular point in your slide is absolutely vital if you want your slides to make an impact. You can do that in all sorts of ways—pointing to the right piece on the slide, using animation, but there’s a cool way you can do this with images too.
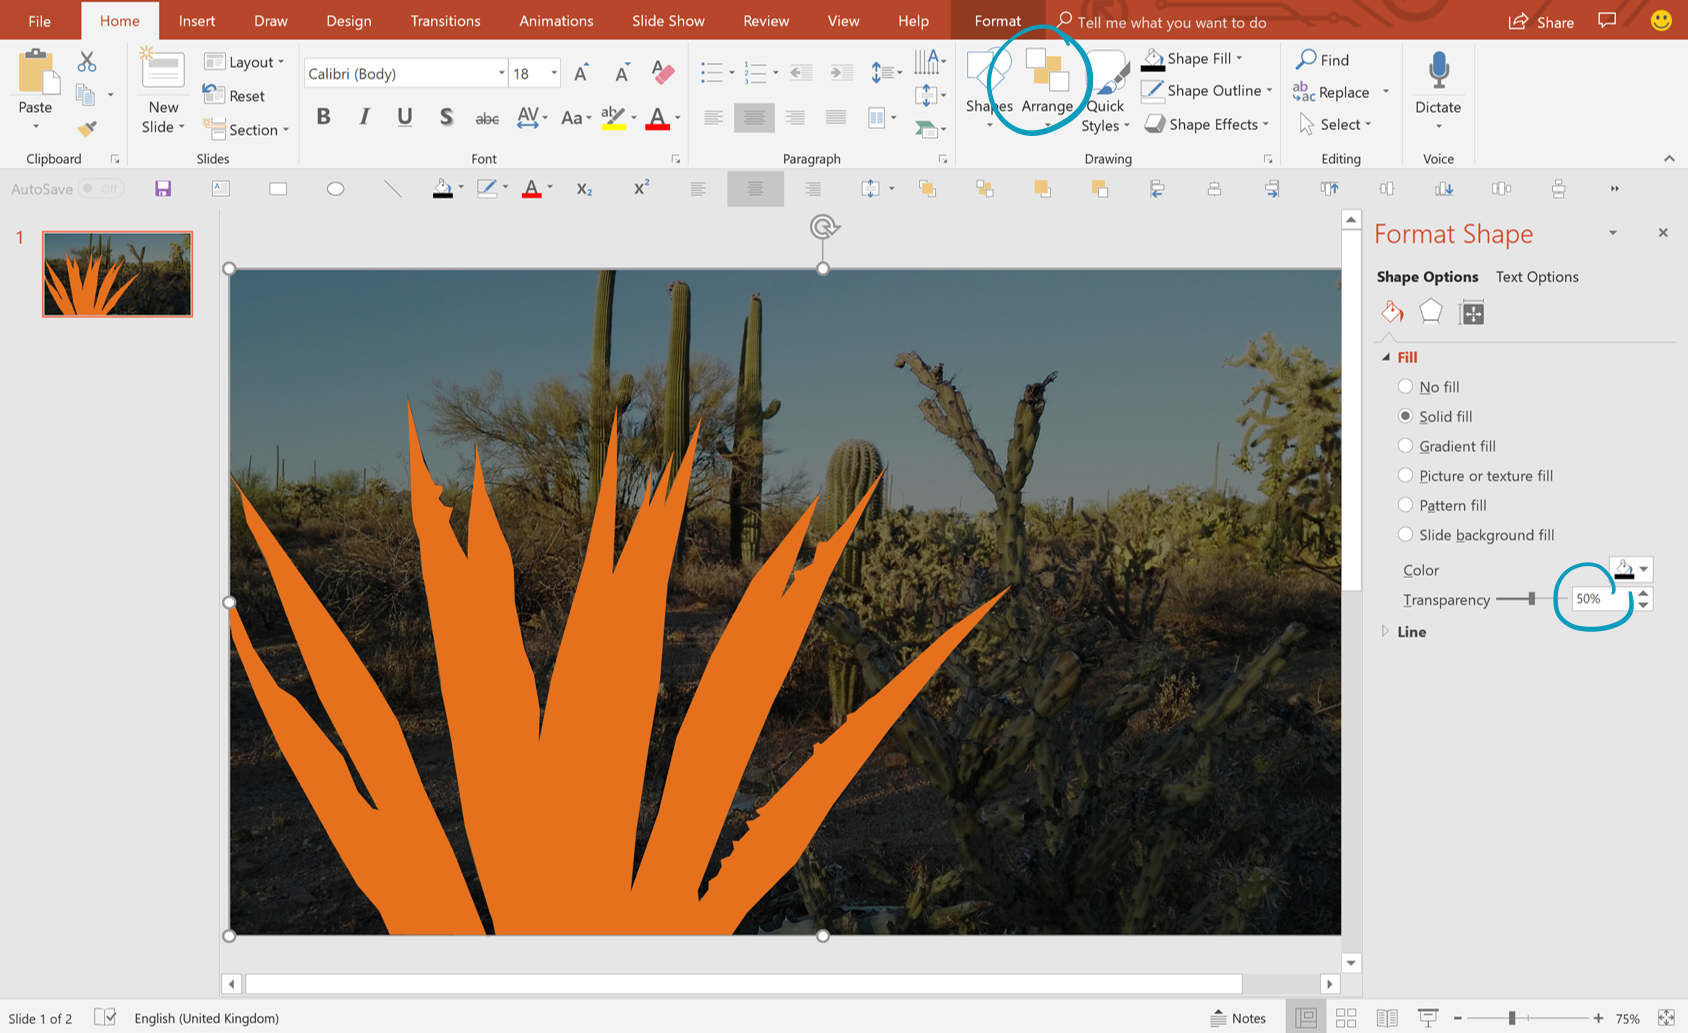
1) Insert your picture and use the freeform tool to draw around the object you want to highlight.

2) Draw a box that covers the original picture. Fill it in either a very dark or very light colour. Format the object to make it semi-transparent, and use the Arrange tools to bring the freeform object to the front.
3) Use the Merge Shapes tool to subtract the freeform object from the semi-transparent box.
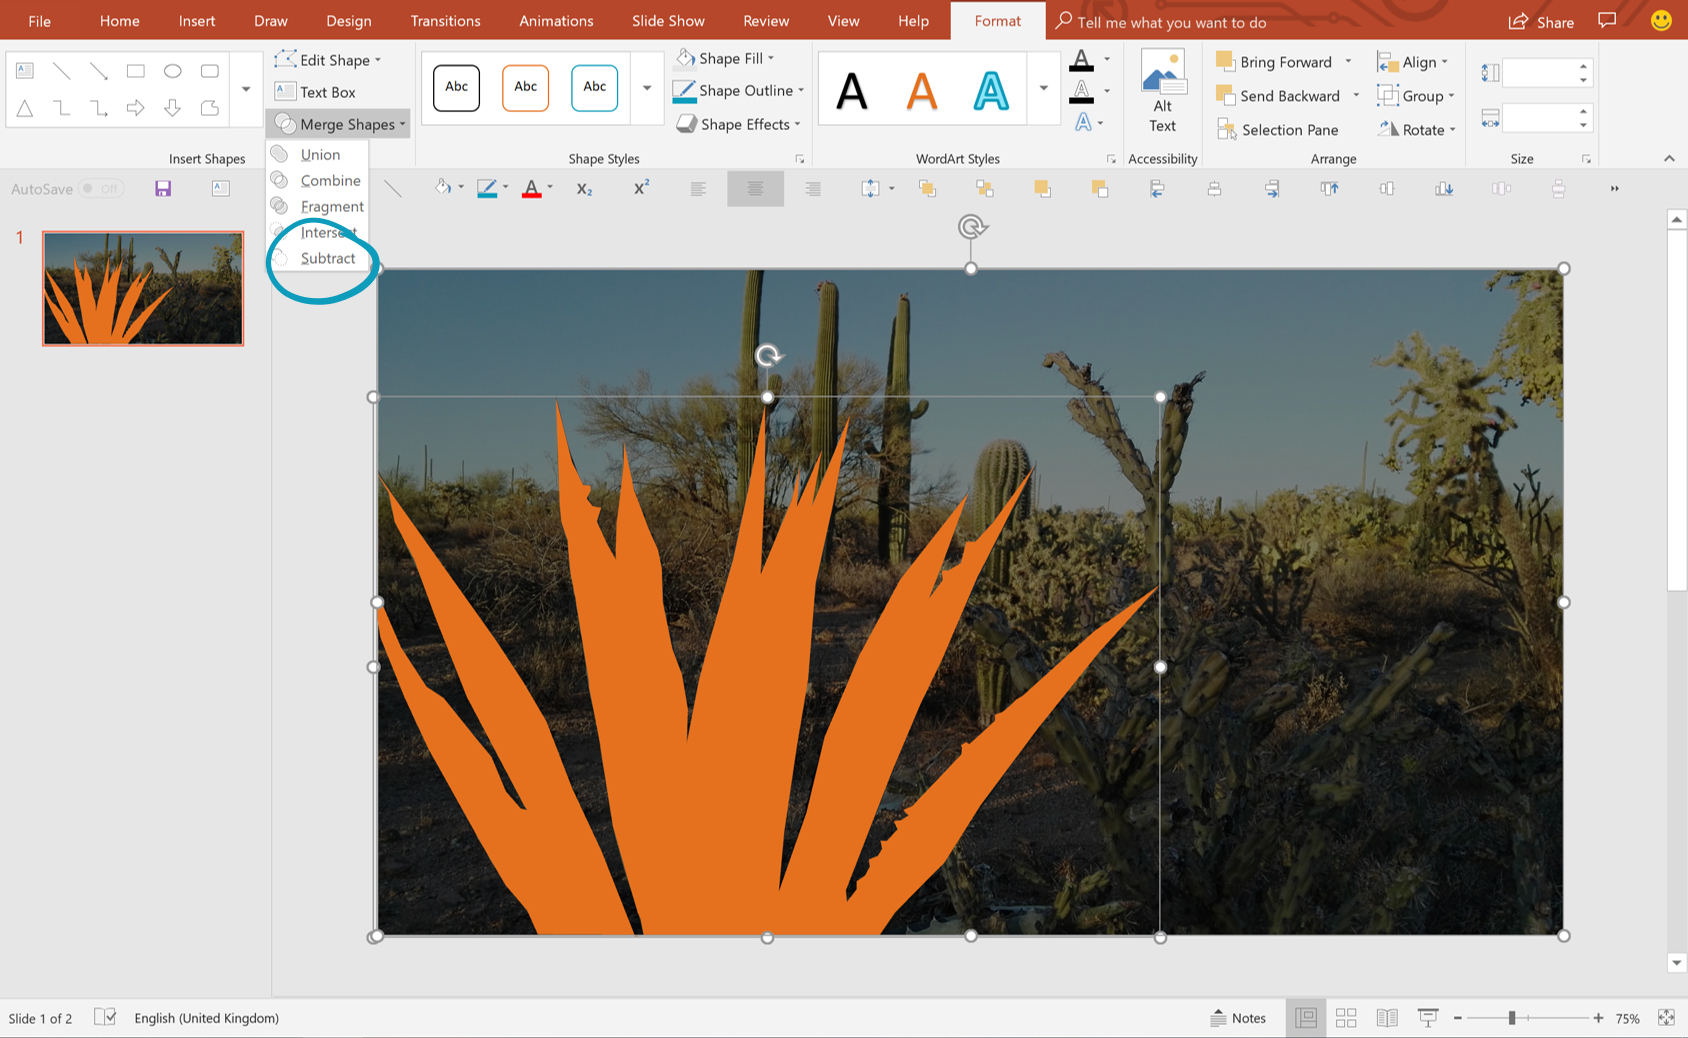
4) Adjust the transparency of the box, and experiment with different colours to get the effect you want. Add a fade animation to the transparent box to really hone your audience’s attention as you tell a story on your slide.

_________________________________________
For more information on BrightCarbon, head over here, and for more of my insights and inspiration, take a look at my ebook, available here.
Related Posts