
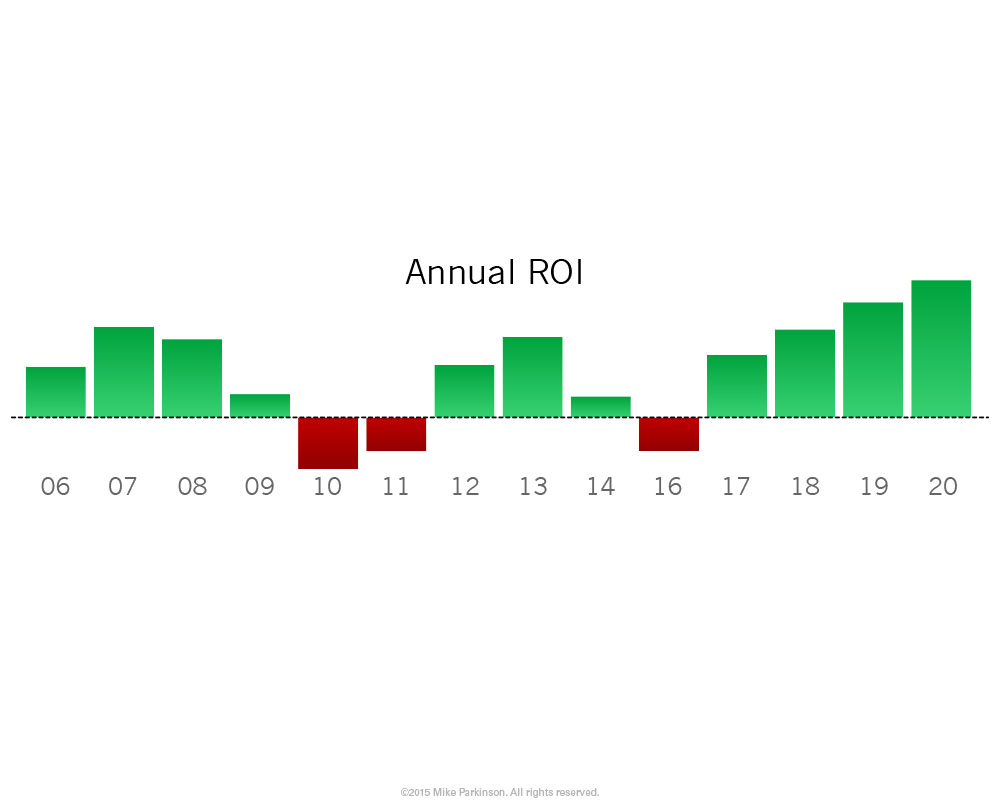
Bar Chart Curved
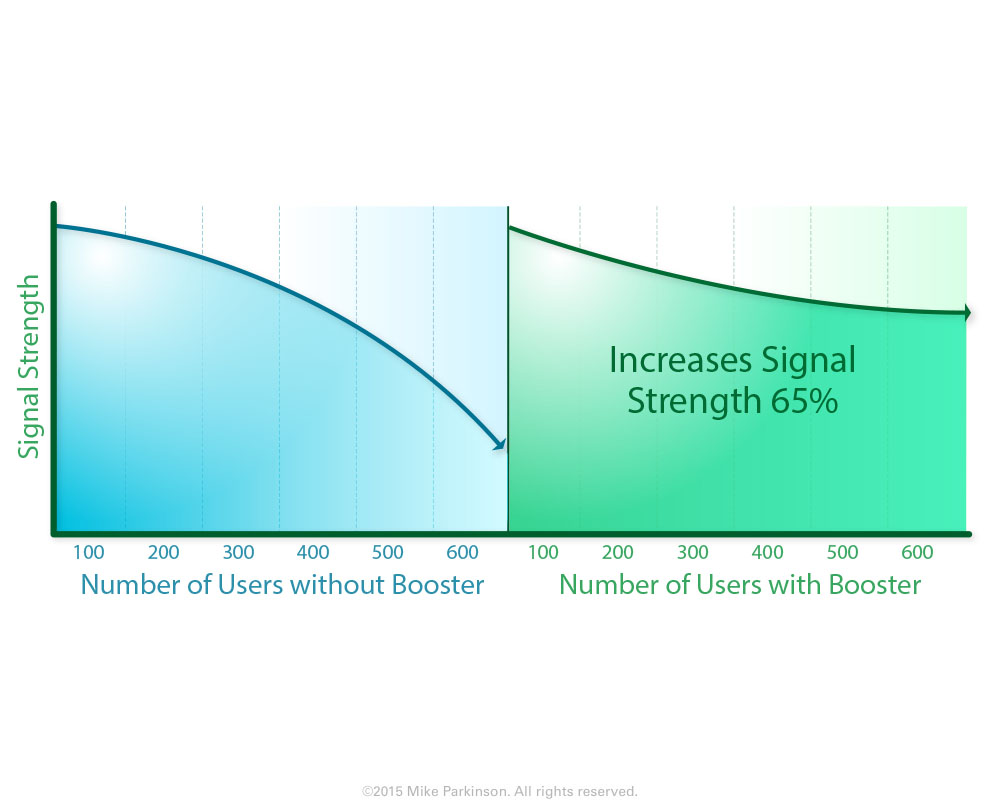
Use this Bar Chart to show amounts, values, and time.

Use this Bar Chart to show amounts, values, and time.
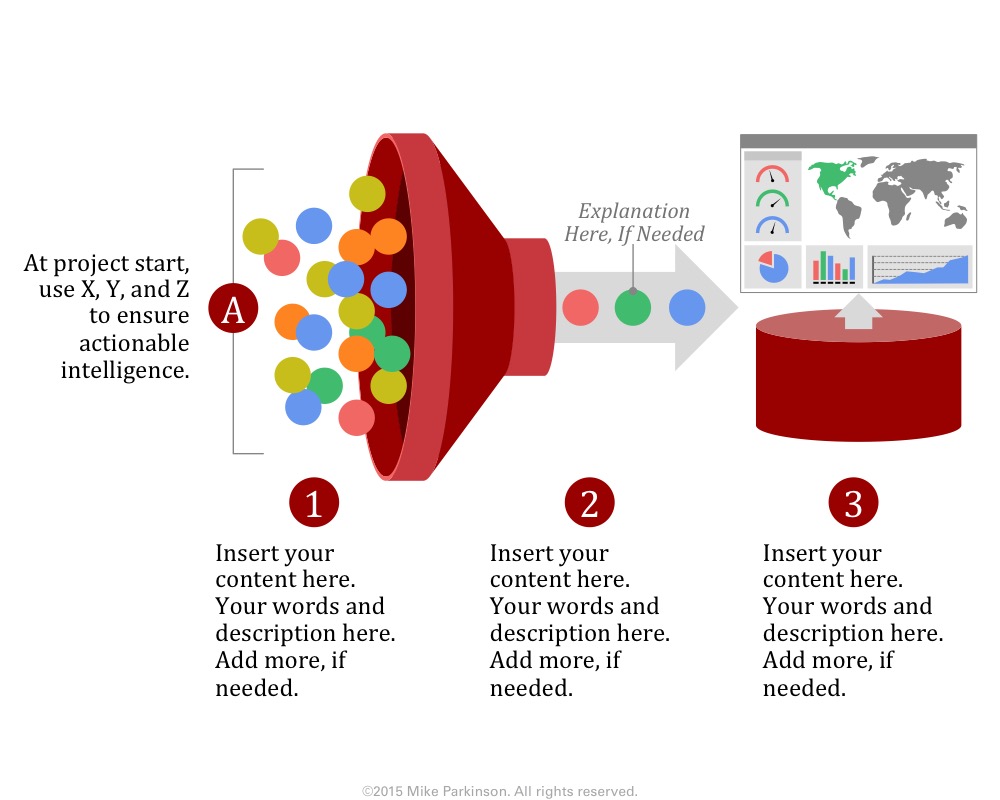
Use this Funnel Graphic as a metaphor showing the passing of elements through a conduit (the funnel) resulting in the…
Use this Area Chart to show amounts, values, and time. This graphic is data driven.

Use this Area Chart to show amounts, values, and time. This graphic is data driven.
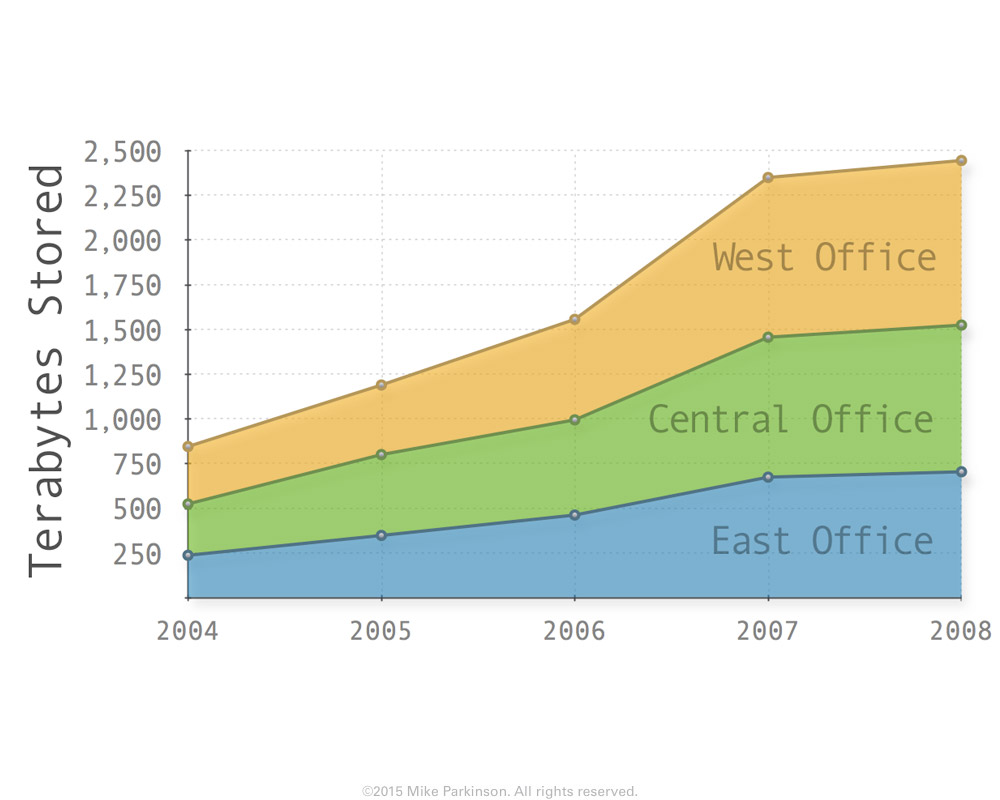
Use this Area Chart to show amounts, values, and time. This graphic is data driven.
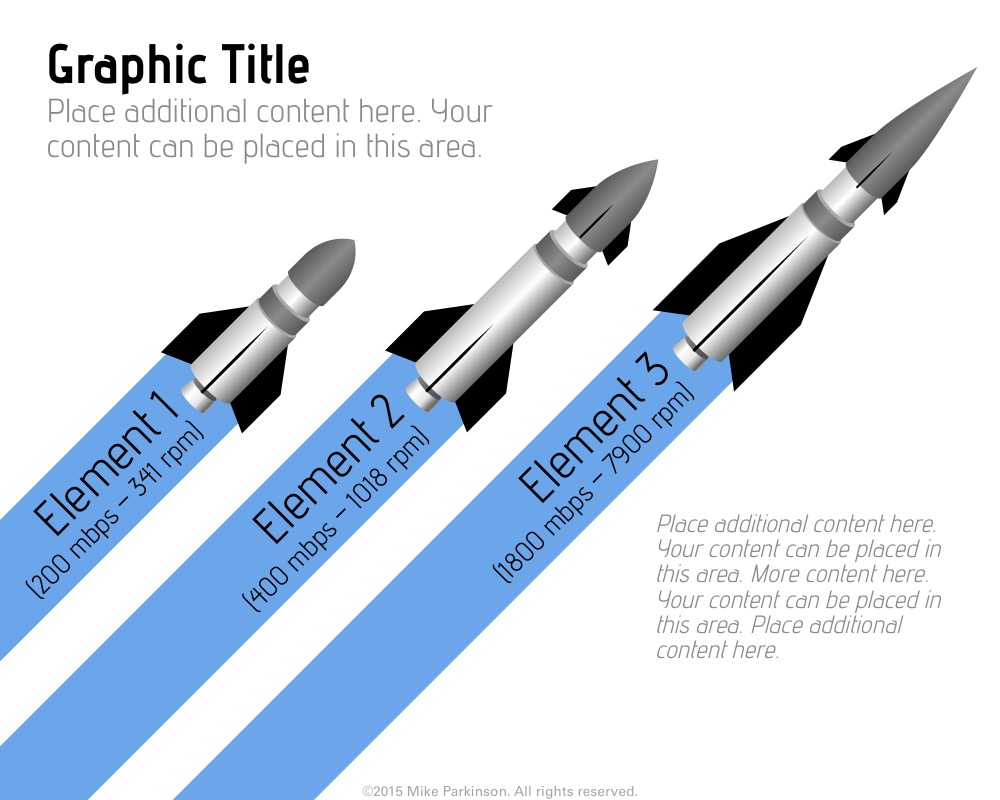
Use this Bar Chart to show amounts, values, and time. This graphic is data driven.
Use this Bar Chart to show amounts, values, and time. This graphic is data driven.
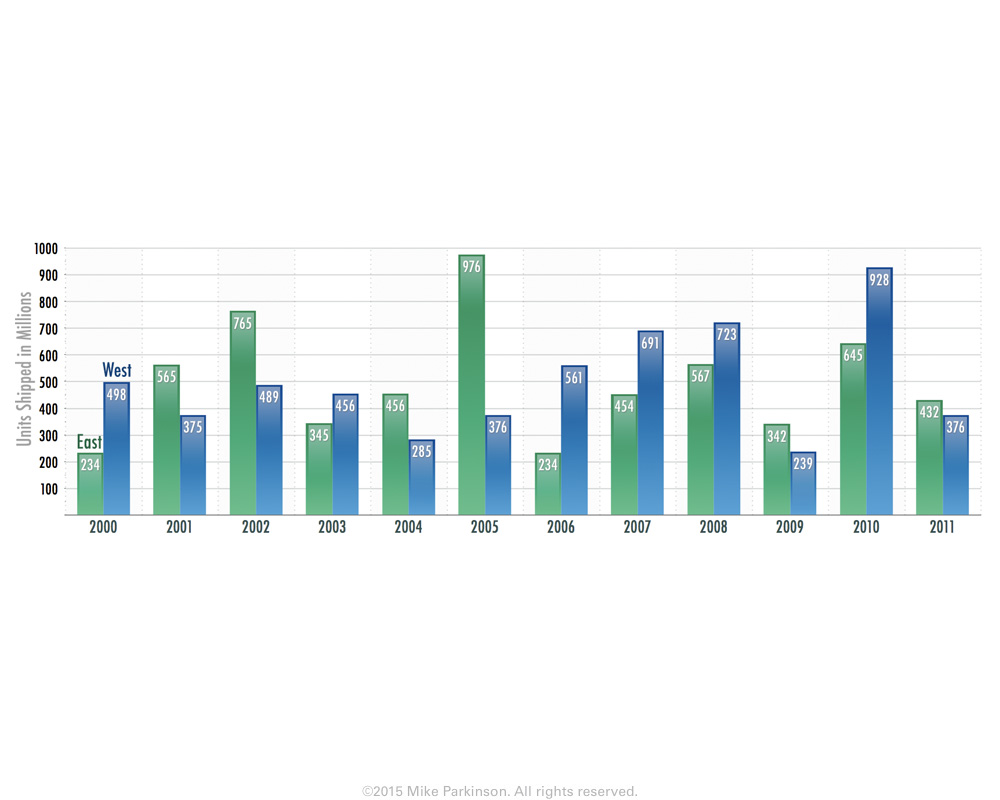
Use this Bar Chart to show amounts, values, and time. This graphic is data driven.
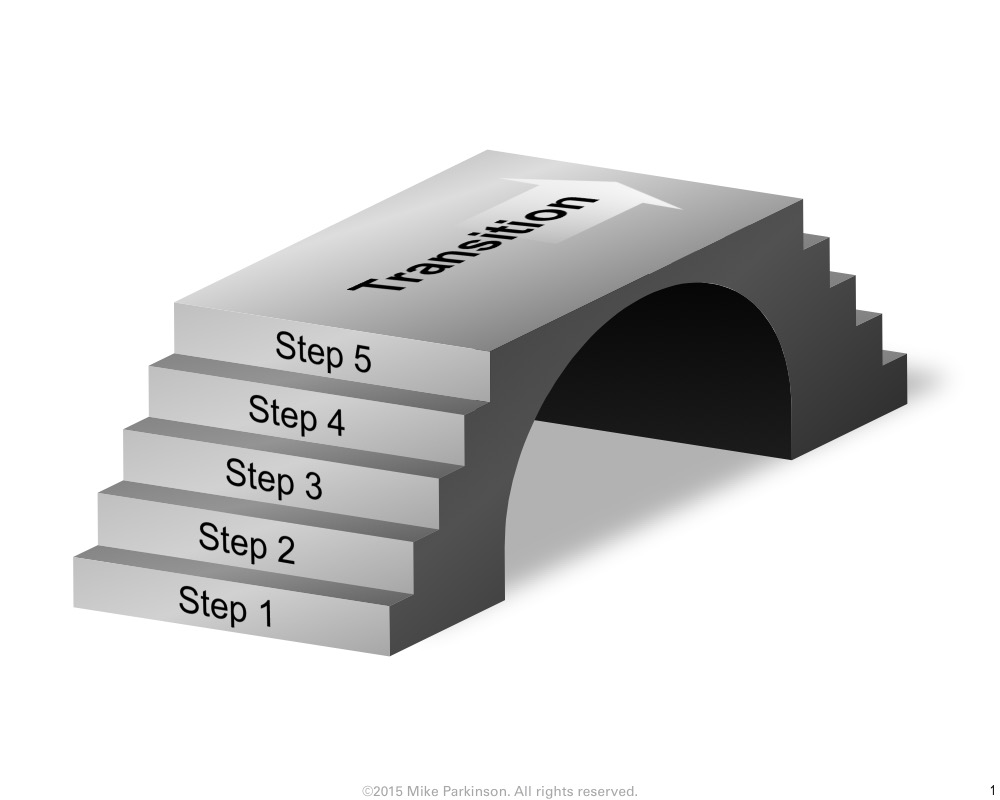
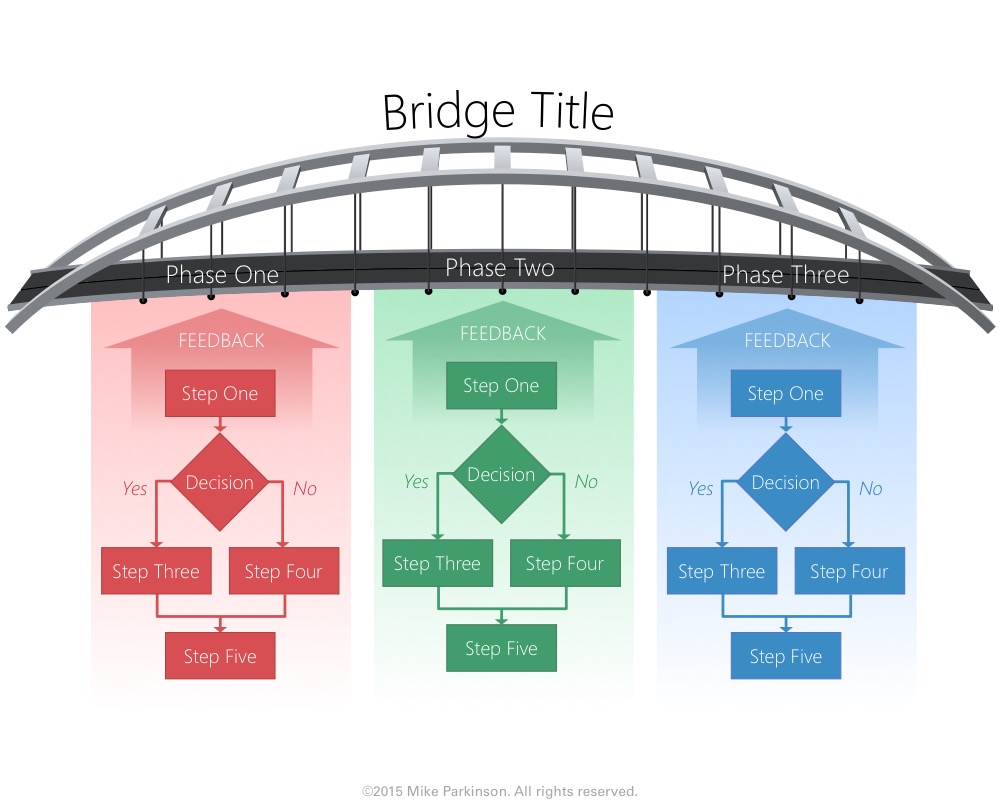
Use this Bridge Graphic as a graphic metaphor to depict the connection or transition between two actions, concepts, or entities.
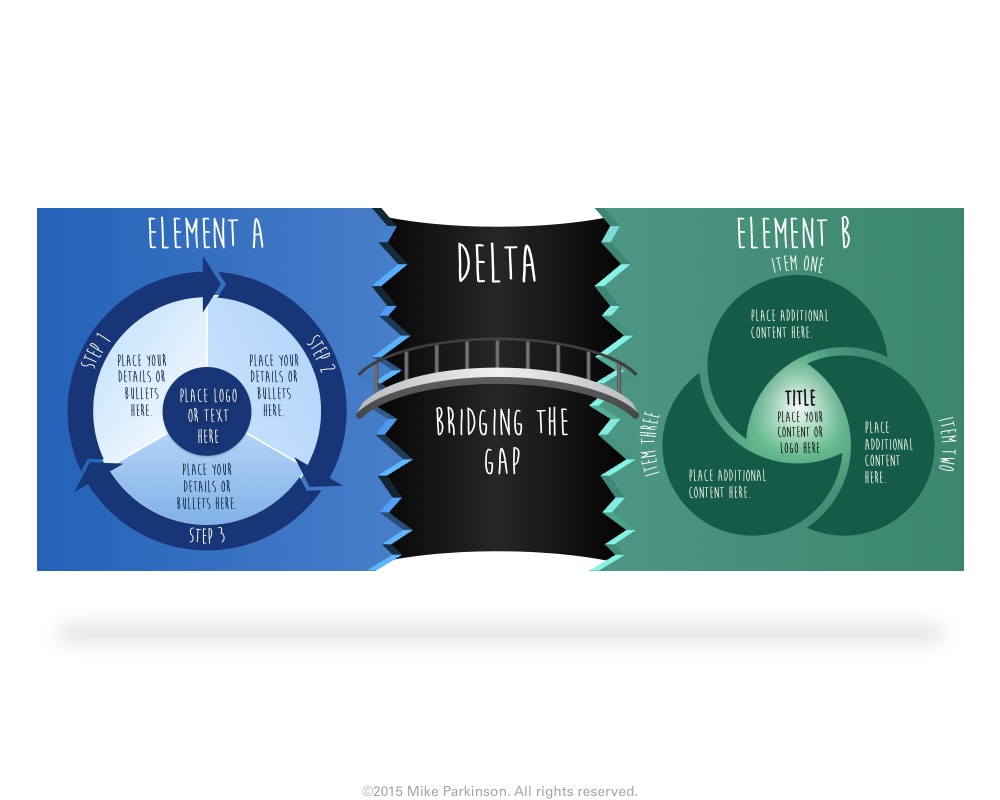
Use this Bridge Graphic as a graphic metaphor to depict the connection or transition between two actions, concepts, or entities.
Use this Bridge Graphic as a graphic metaphor to depict the connection or transition between two actions, concepts, or entities.
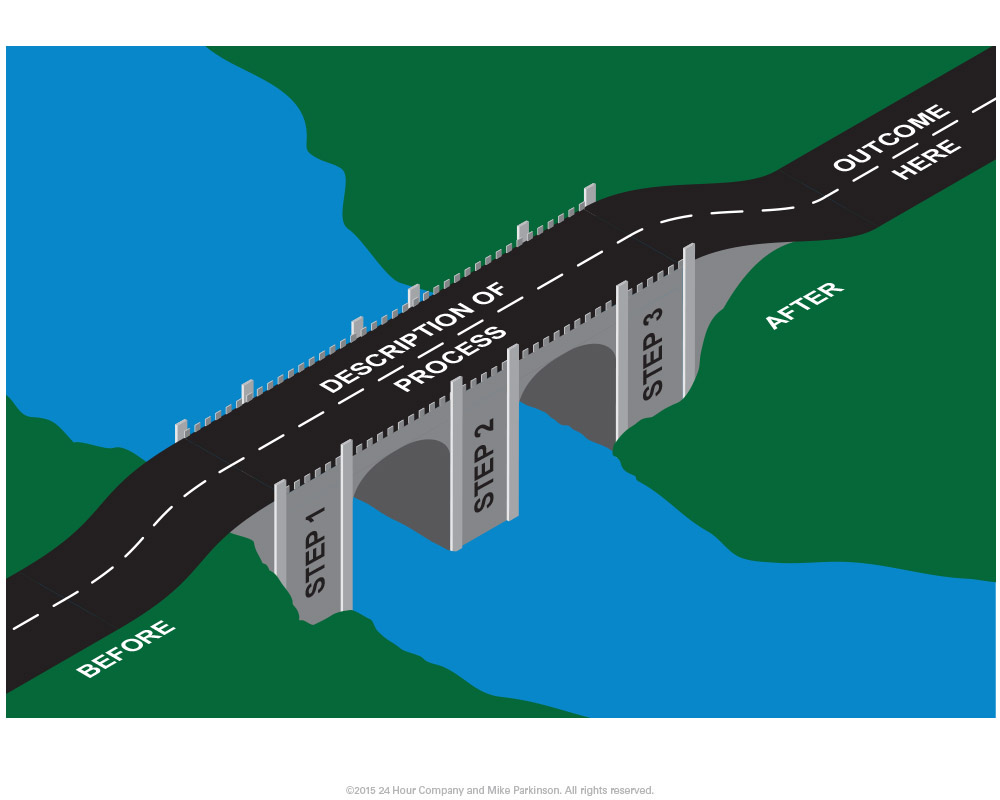
Use this Bridge Graphic as a graphic metaphor to depict the connection or transition between two actions, concepts, or entities.