Process Diagram
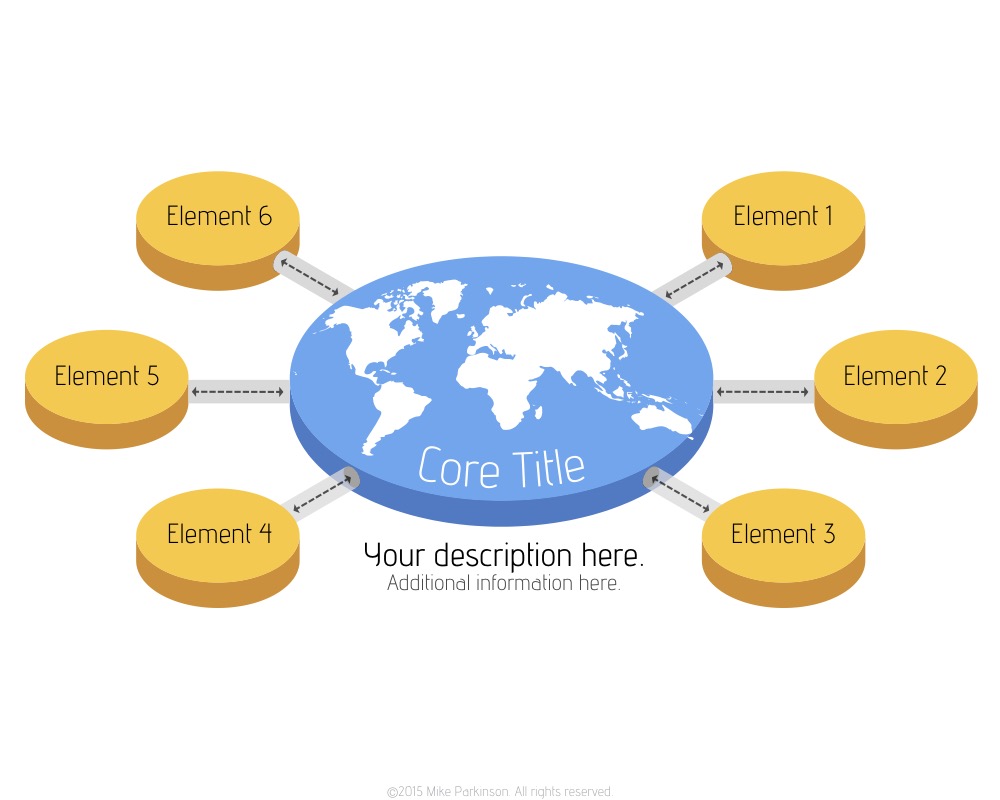
Use this Process Diagram to show relationships, influences, and interactions.

Use this Process Diagram to show relationships, influences, and interactions.
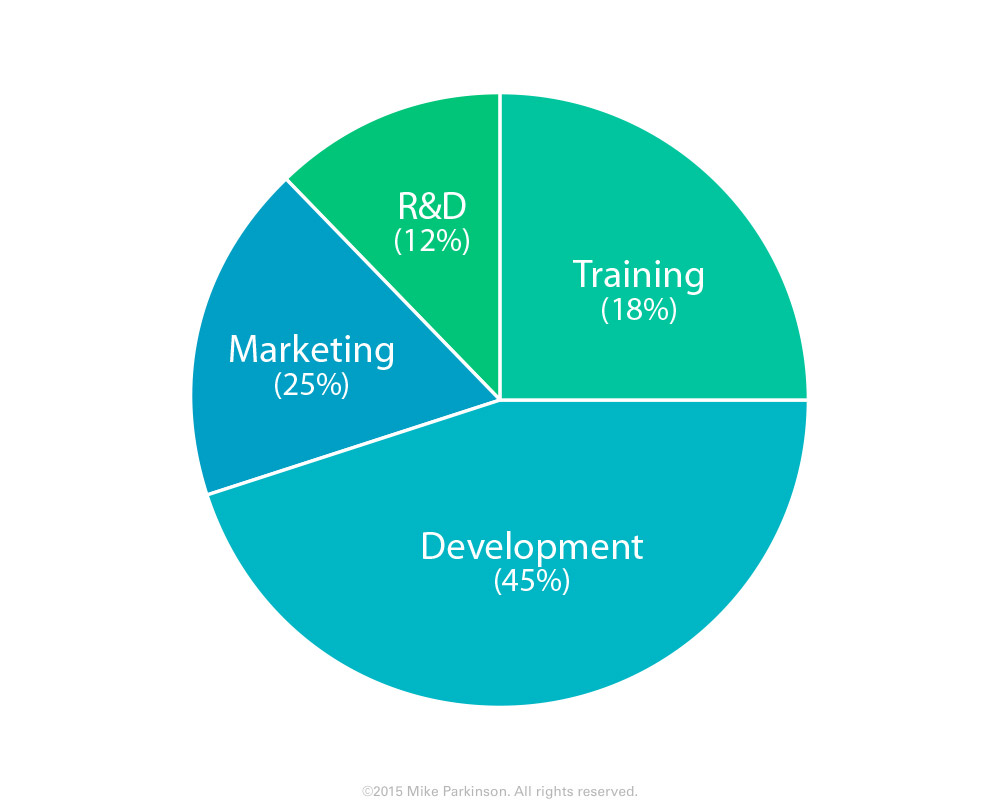
Use this Pie Chart to show percentages relative to the whole.
Use this Pie Chart to show percentages relative to the whole.
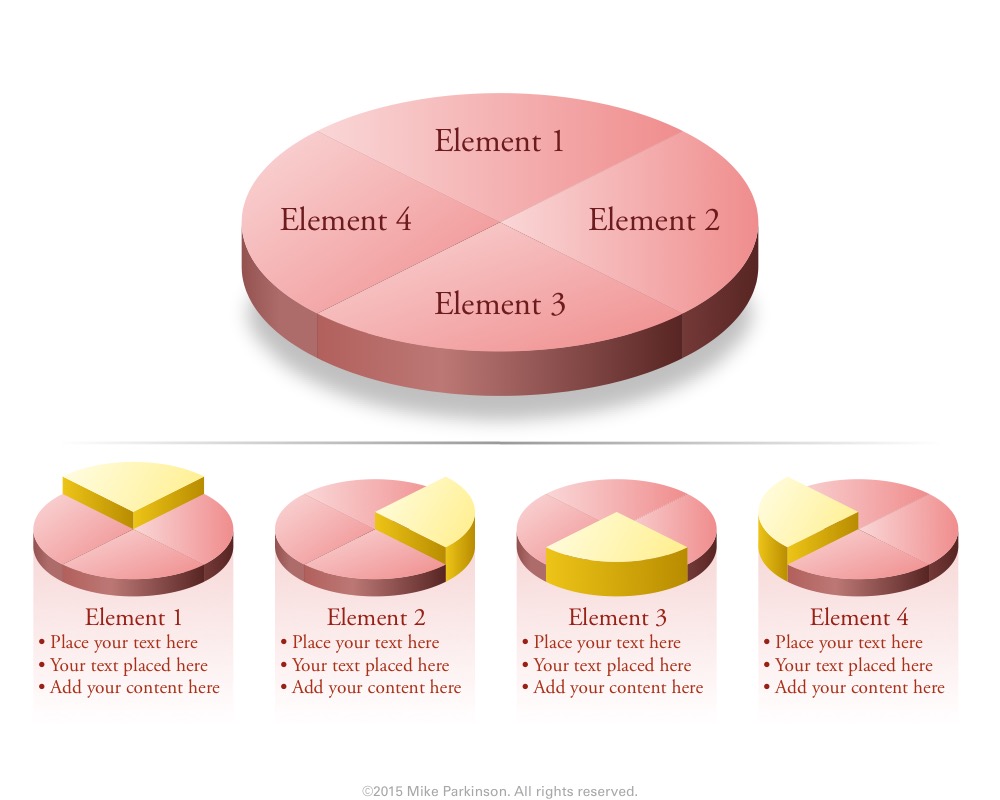
Use this Pie Chart to show percentages relative to the whole.
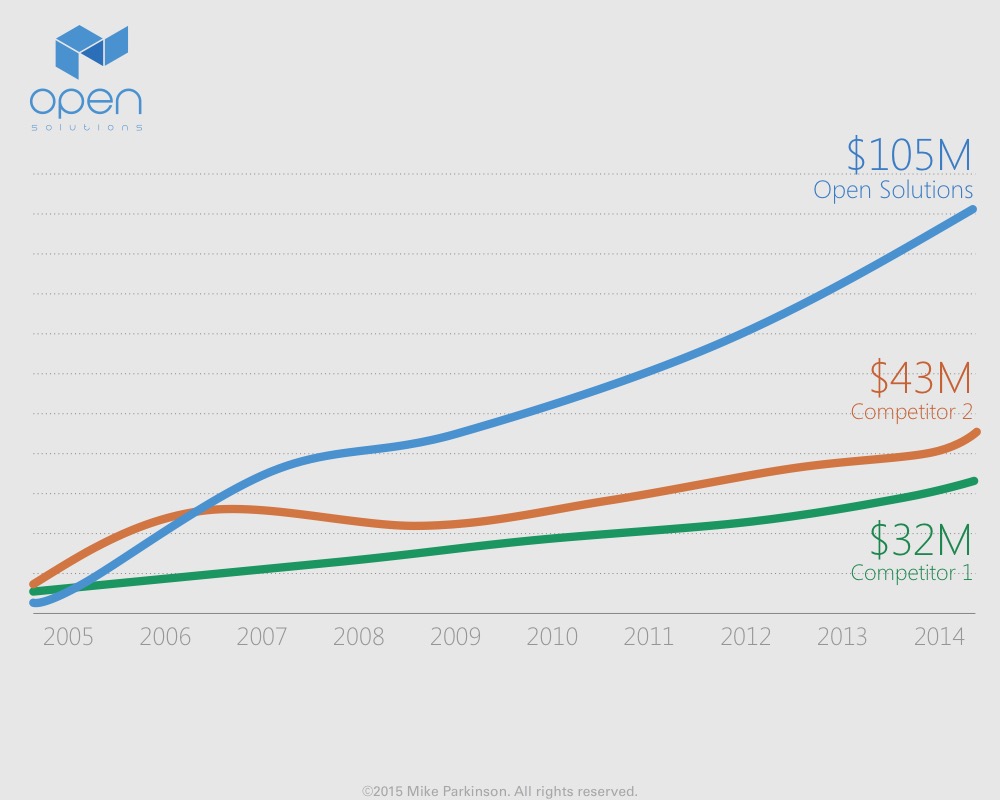
Use this Line Chart/Bar Chart hybrid to show quantitative data. This graphic is data driven.
Use this Line Chart/Bar Chart hybrid to show quantitative data. This graphic is data driven.
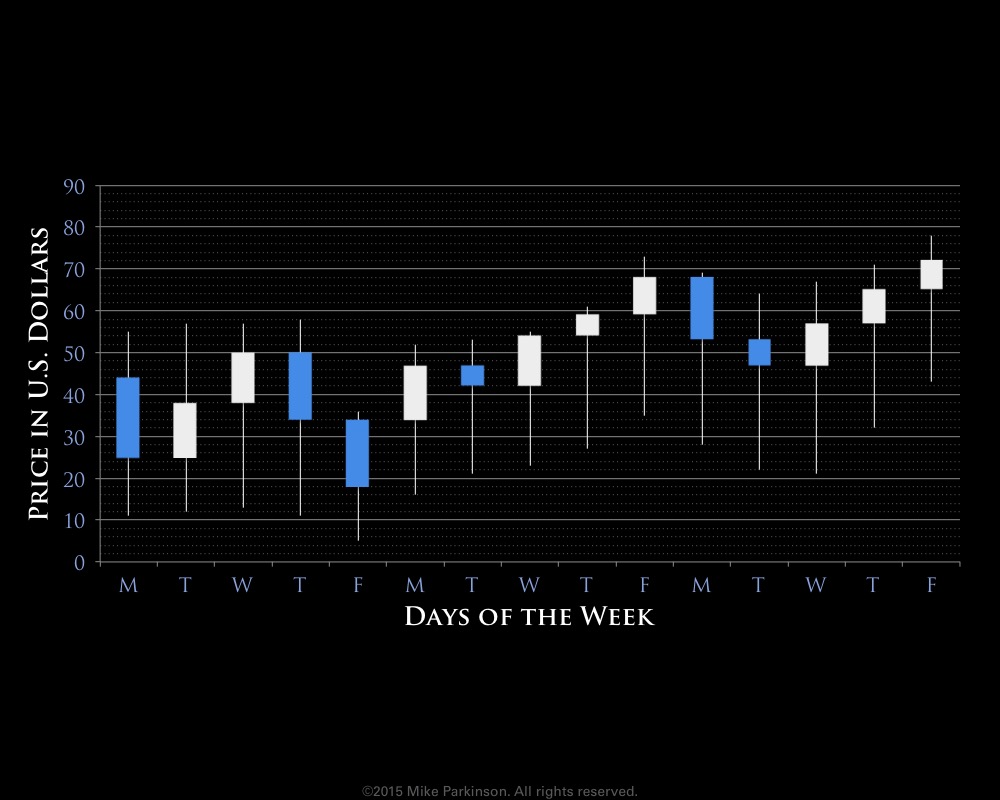
Use this Candlestick Chart to show changes in value and other information pertaining to stocks, bonds, commodities, etc. This graphic…
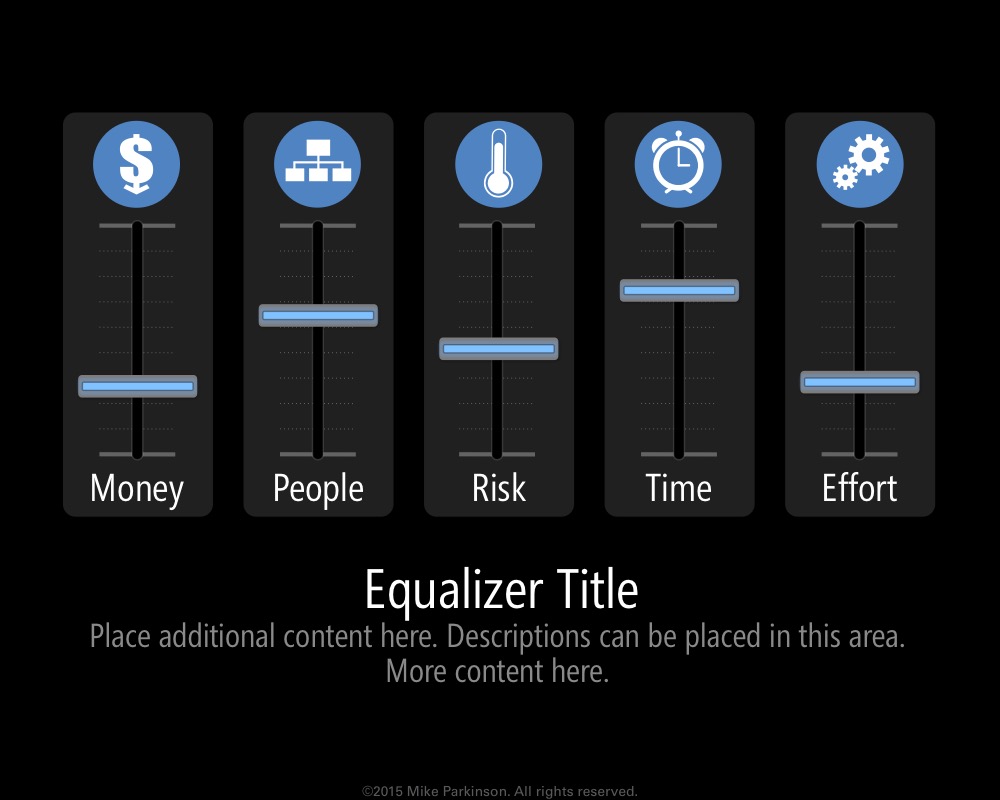
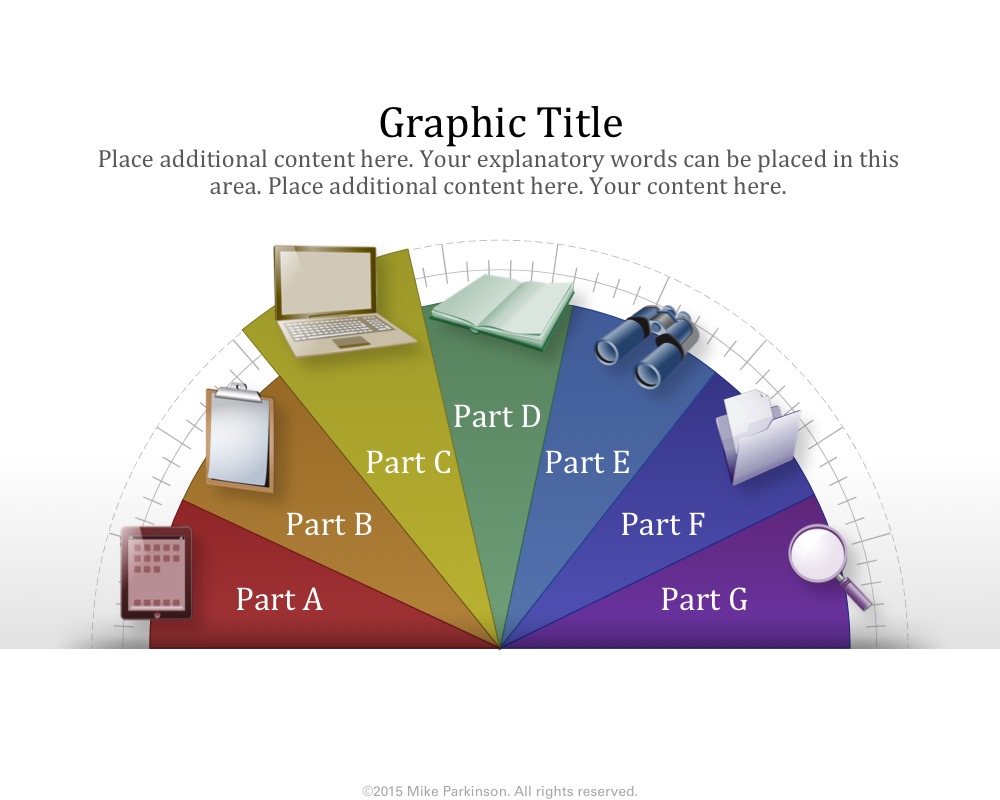
Use this Gauge Graphic to present data in a unique and professional way.
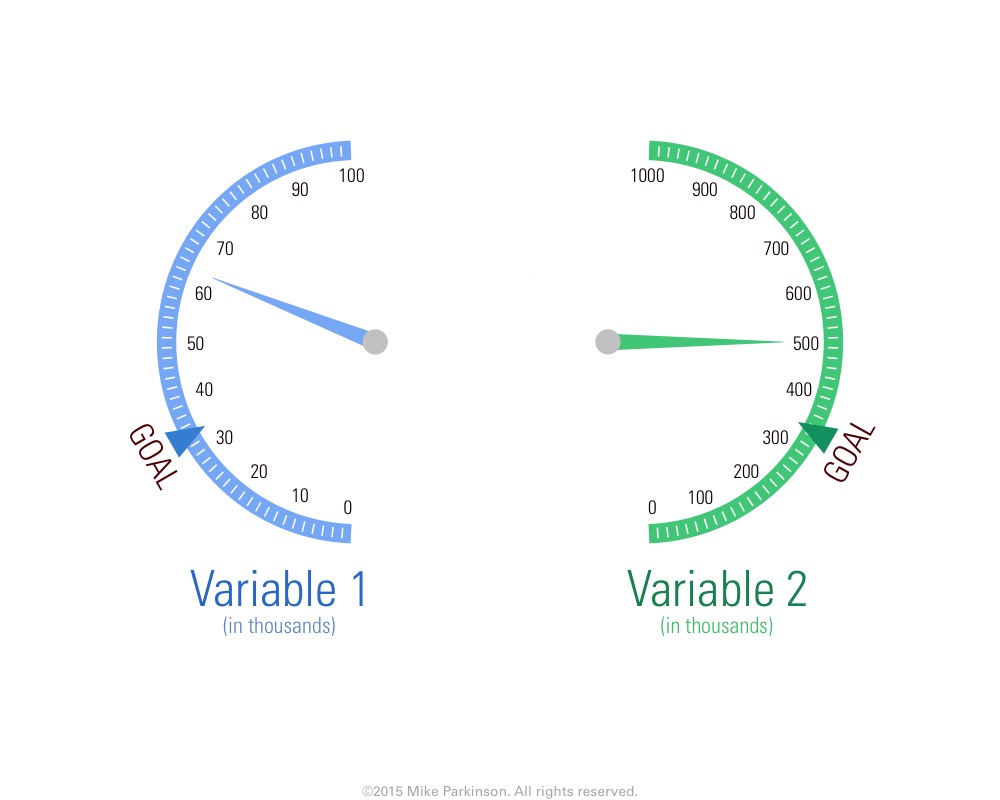
Use this Gauge Graphic to present data in a unique and professional way.
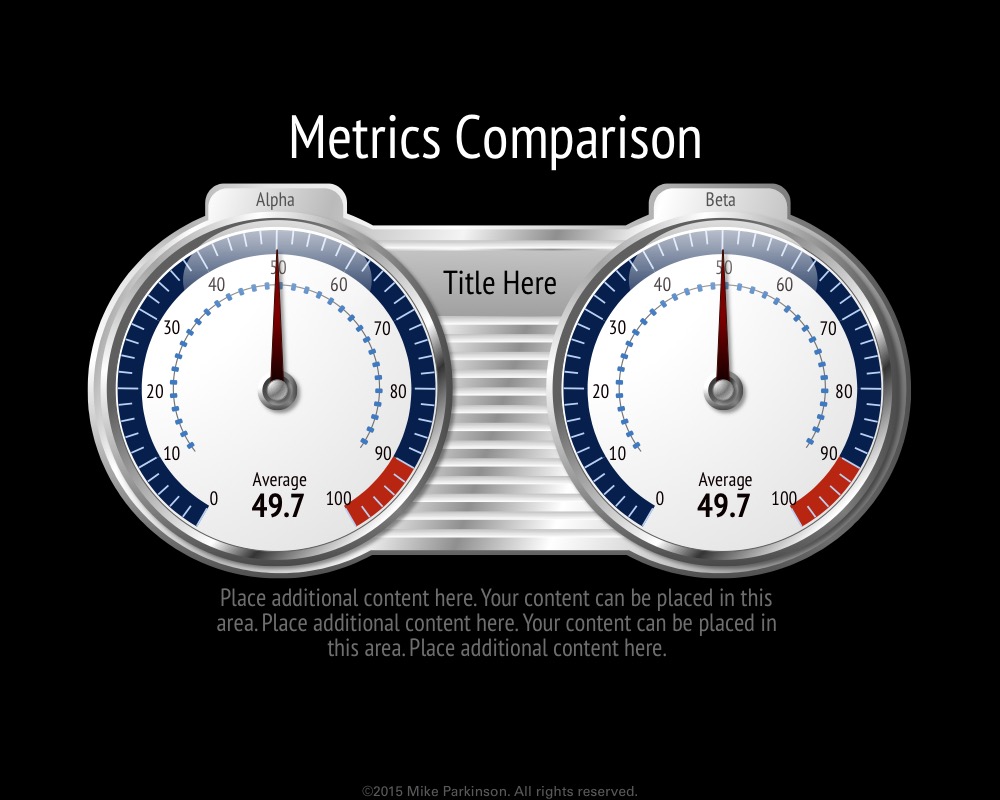
Use this Gauge Graphic to present data in a unique and professional way.
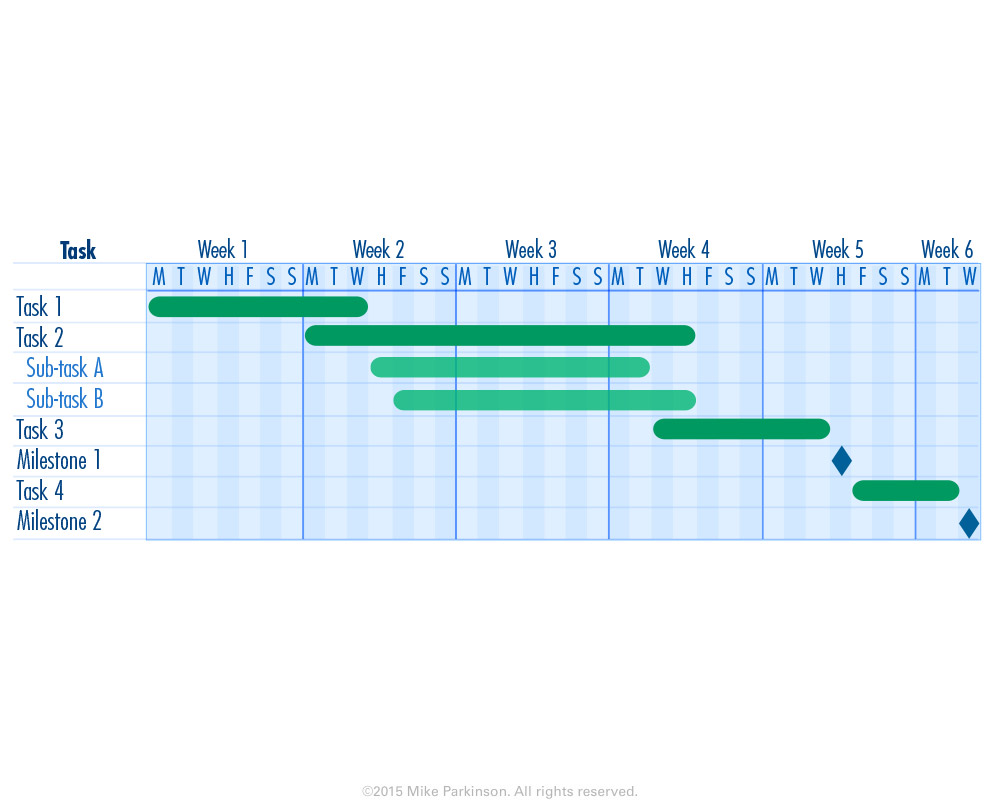
Use this Gantt Chart to communicate schedule and activity for tracking, planning, review purposes. (This chart is NOT data driven.)
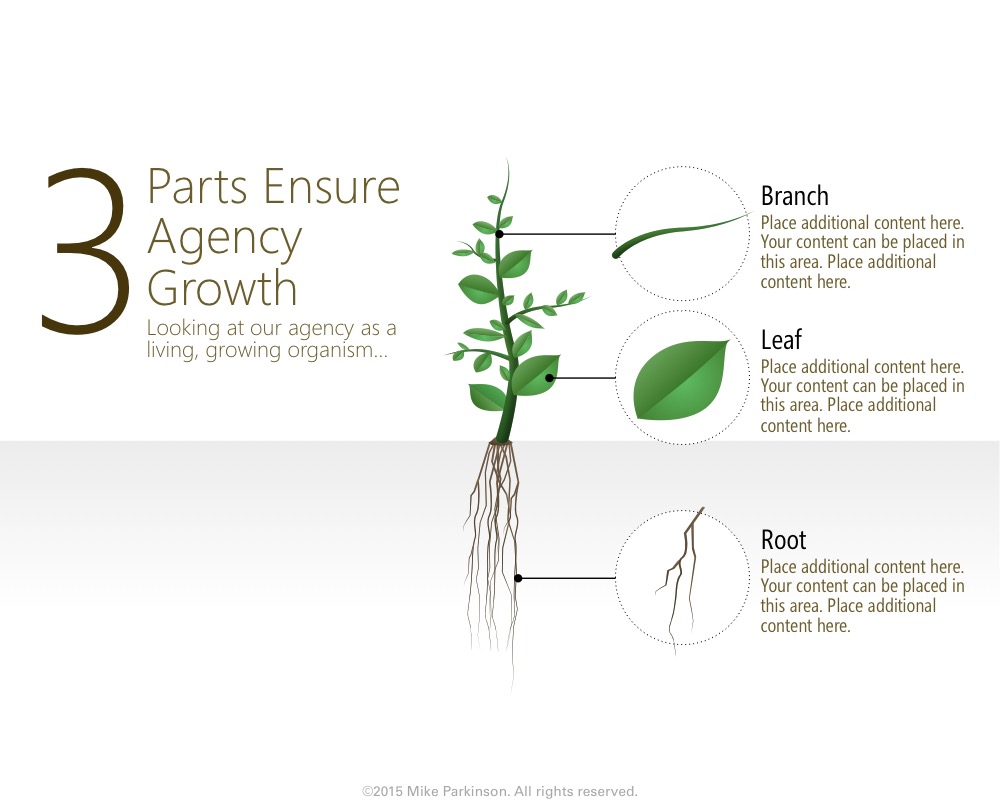
Use this graphic as a branching diagram or visual metaphor depicting categories and groupings of elements to show cause and…