
Venn Diagram
Use this Venn Diagram to show the relationship and/or synergy of disparate elements through the overlap of those elements.

Use this Venn Diagram to show the relationship and/or synergy of disparate elements through the overlap of those elements.
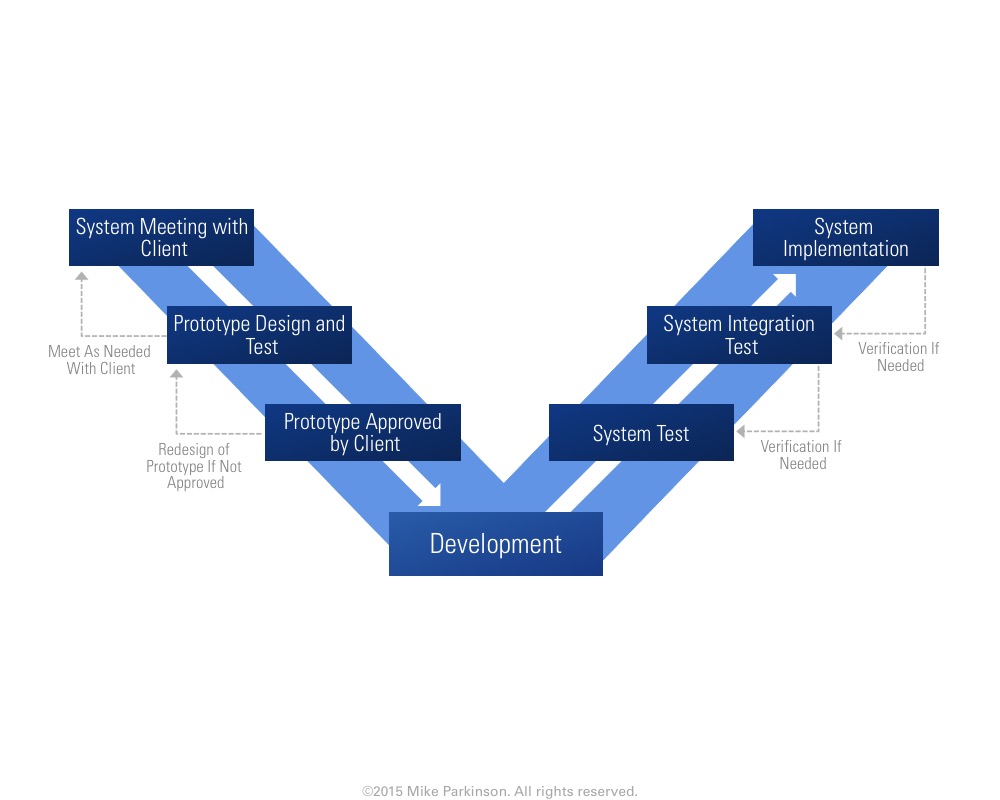
Use this Vee Diagram to illustrate relationships, and a process for validation and verification. (Also called an IV&V Diagram.)

Use this Temple Graphic to depict steps in a process and show support, grouping, and hierarchy.
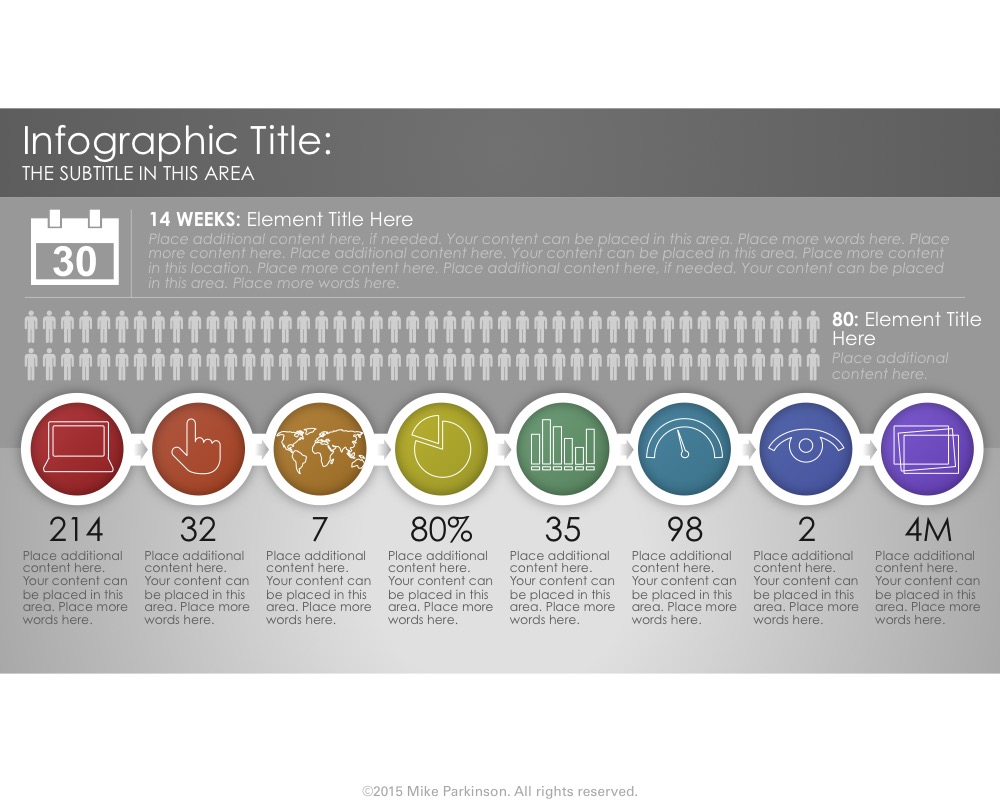
Use this Infographic to showcase interconnected information related to a specific topic.
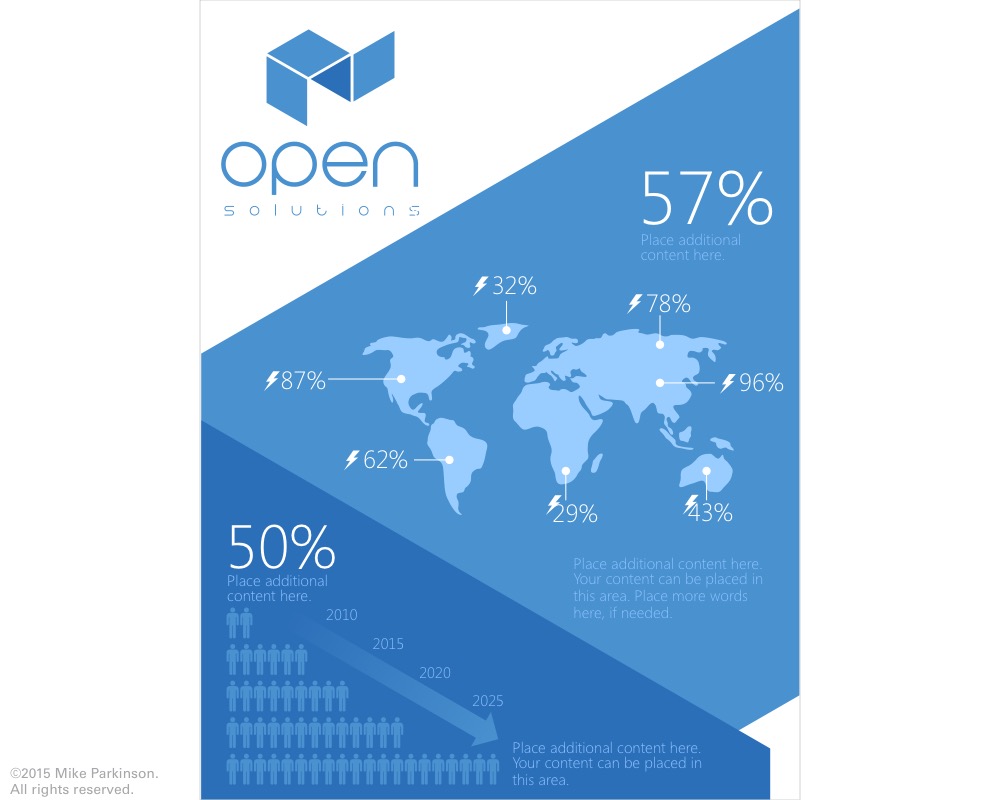
Use this Infographic to showcase interconnected information related to a specific topic.
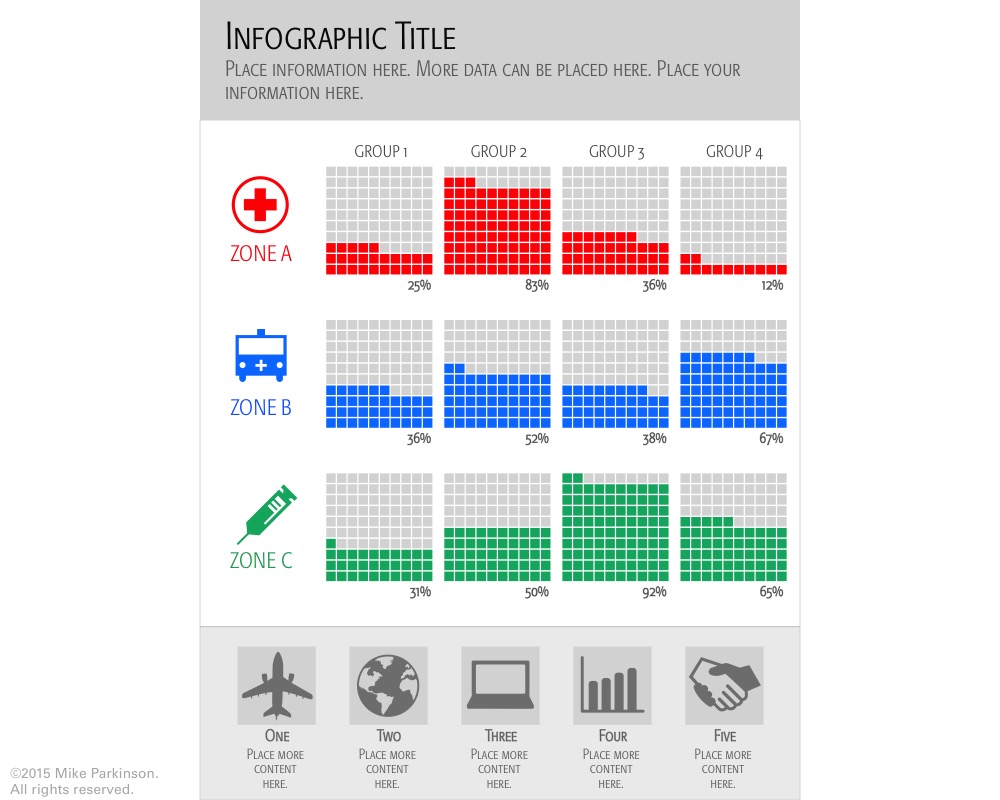
Use this Infographic to showcase interconnected information related to a specific topic.

Use this Infographic to showcase interconnected information related to a specific topic.

Use this Infographic to showcase interconnected information related to a specific topic.
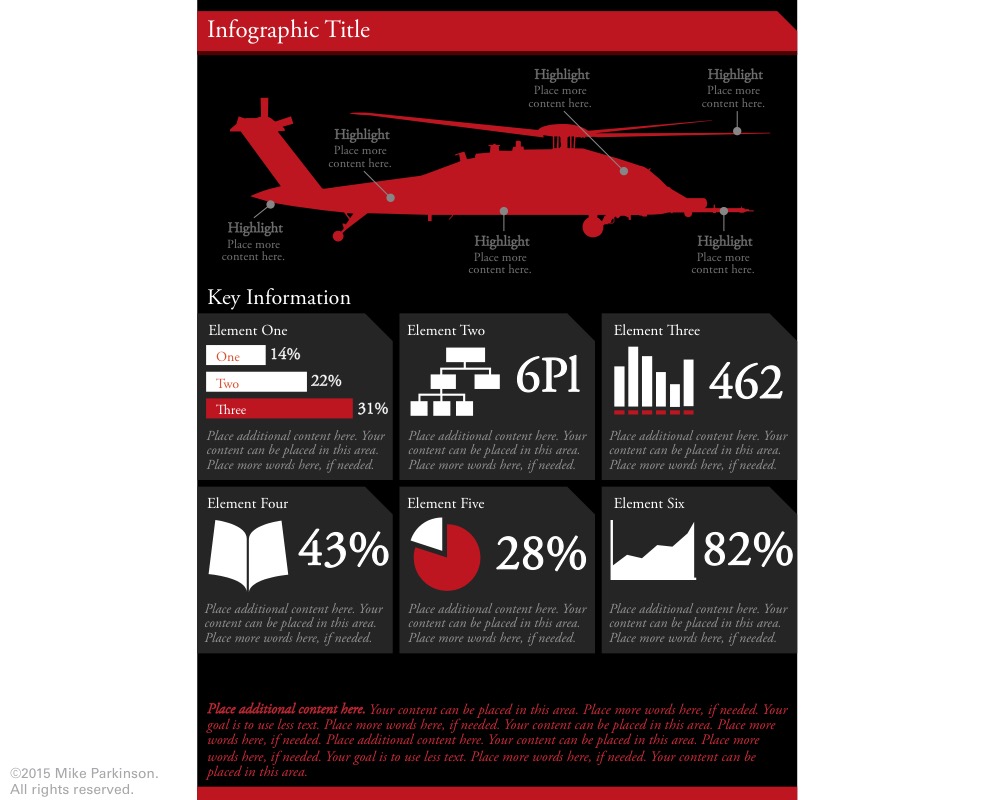
Use this Infographic to showcase interconnected information related to a specific topic.
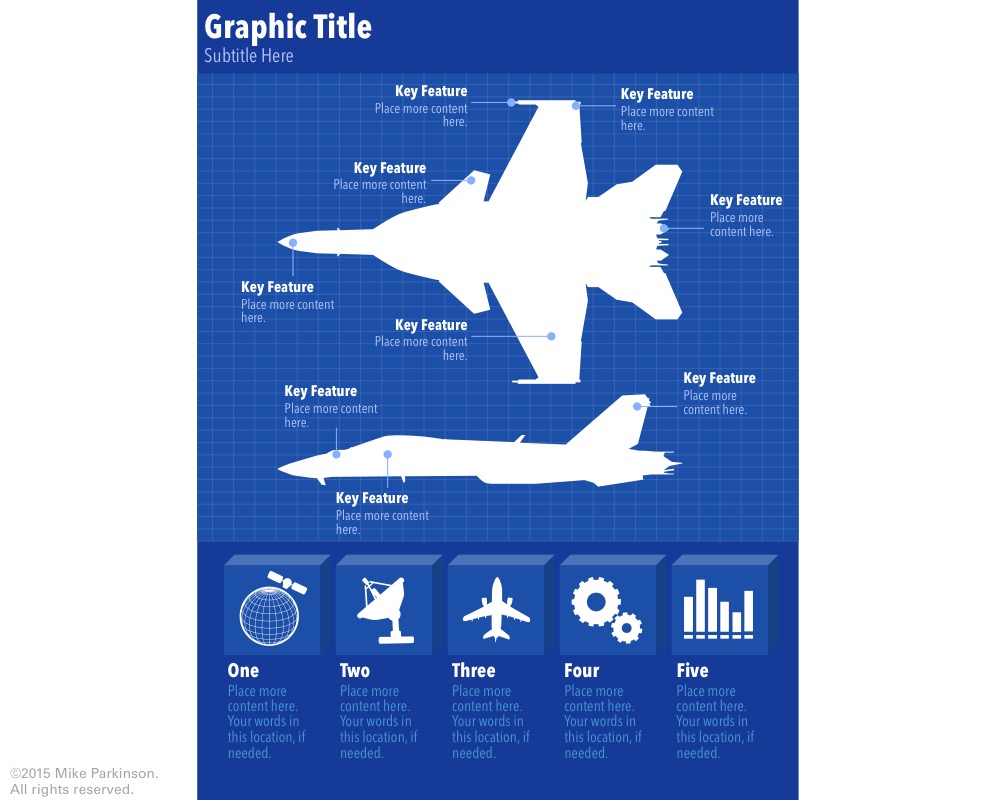
Use this Infographic to showcase interconnected information related to a specific topic.
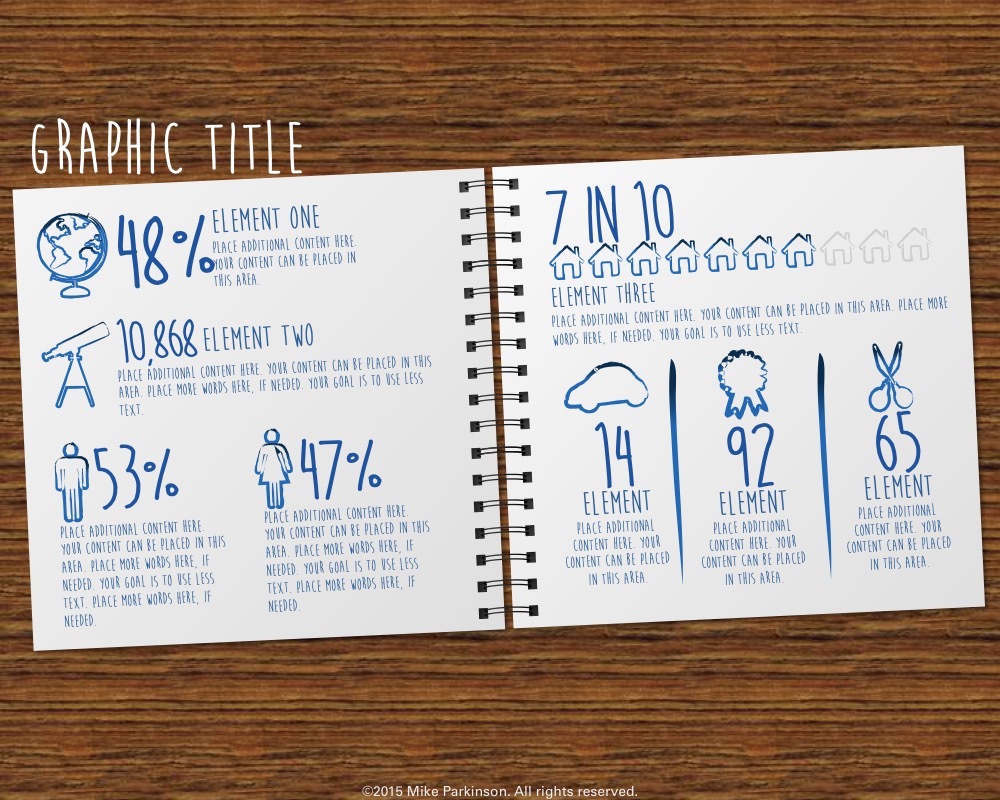
Use this Infographic to showcase interconnected information related to a specific topic.

Use this Infographic to showcase interconnected information related to a specific topic.