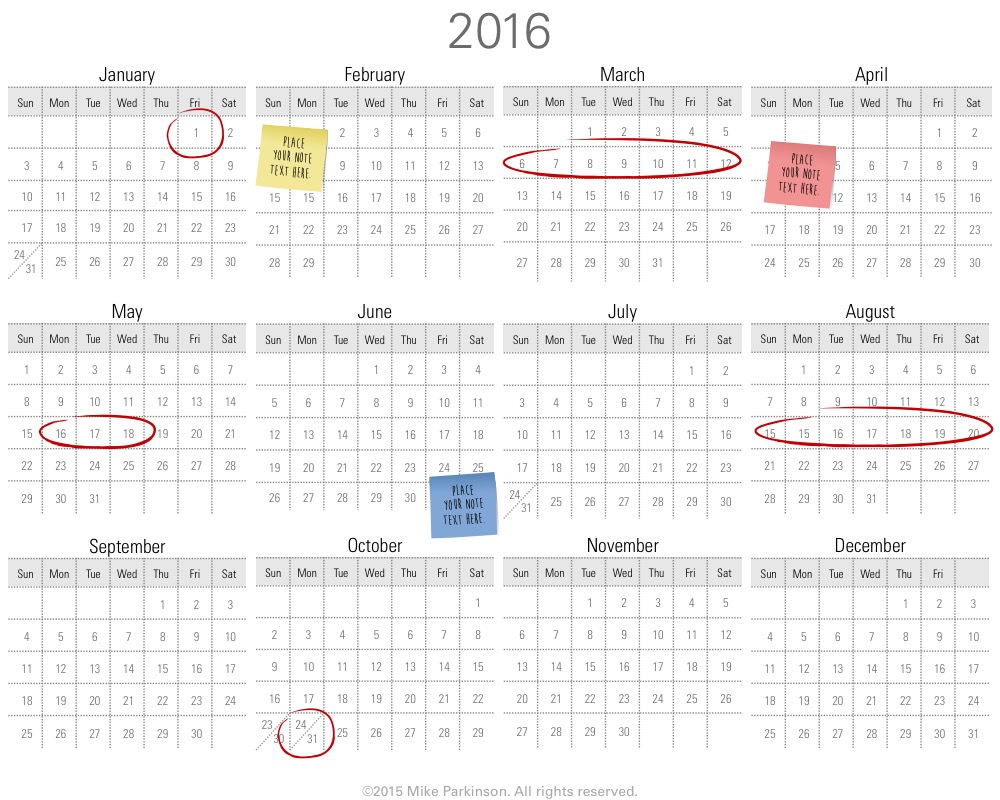
Calendar Graphic
Use this Calendar to show schedules, events, and activities.

Use this Calendar to show schedules, events, and activities.
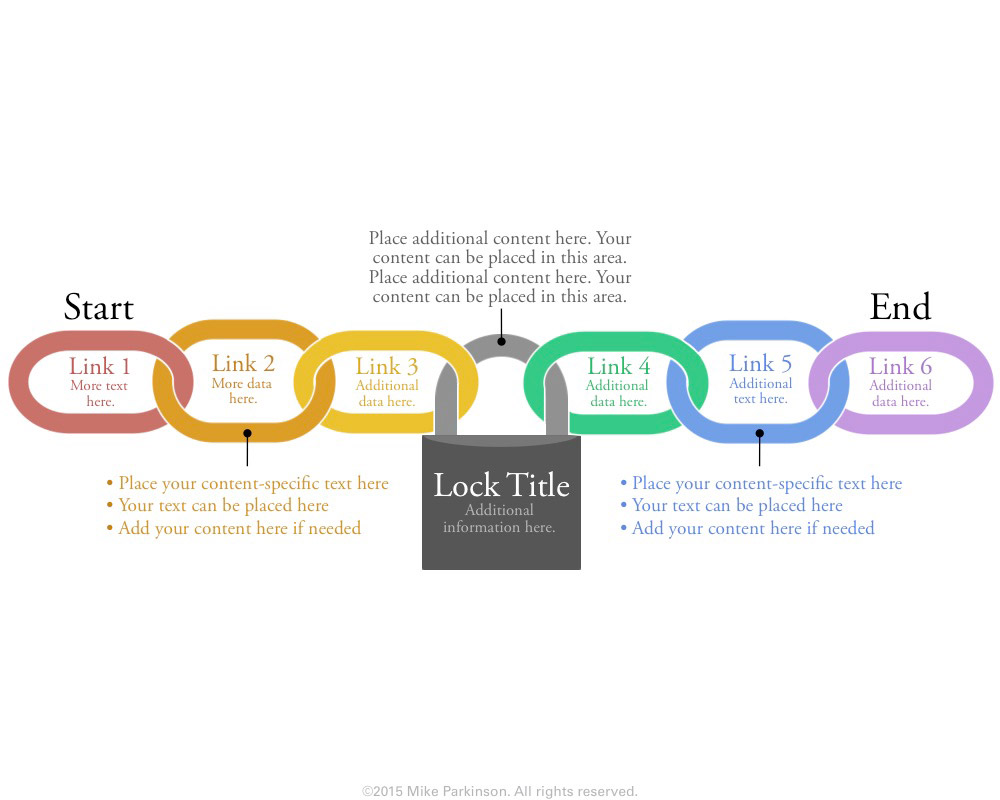
Use this Chain Graphic to show "linked" actions, concepts, or entities. Alternatively, chains illustrate restraint or security.
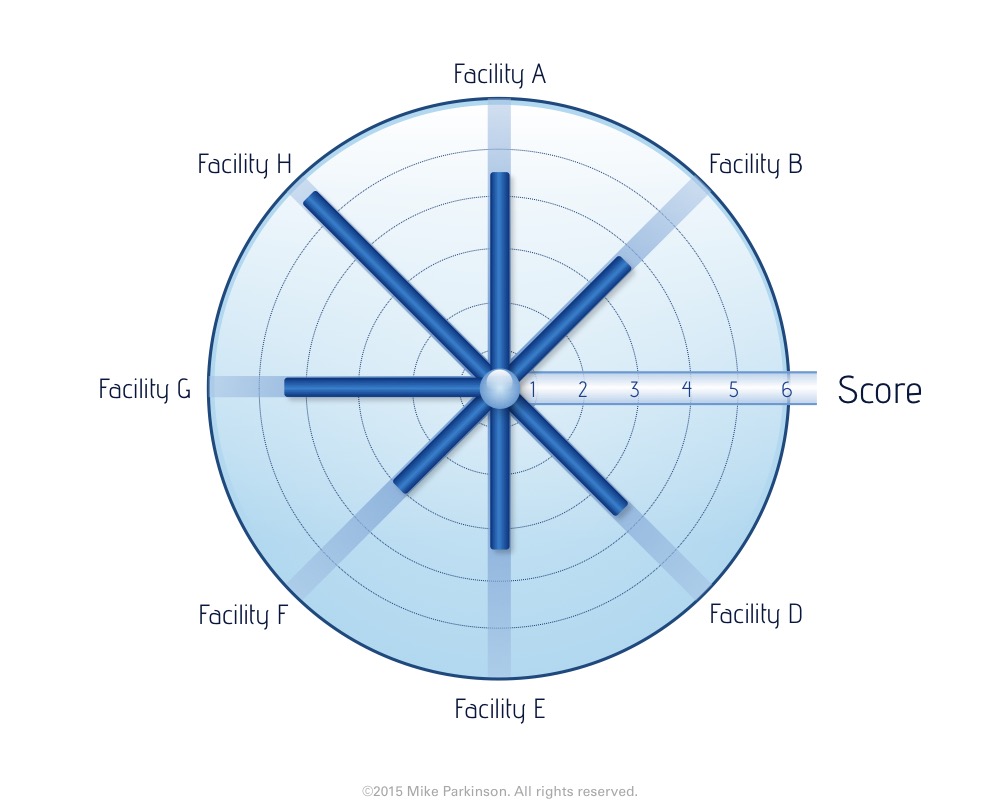
Use this Circle Chart to show changing amounts, values, or time. (This graphic is NOT data driven.)

Use this Circle Chart to show changing amounts, values, or time. (This graphic is NOT data driven.)
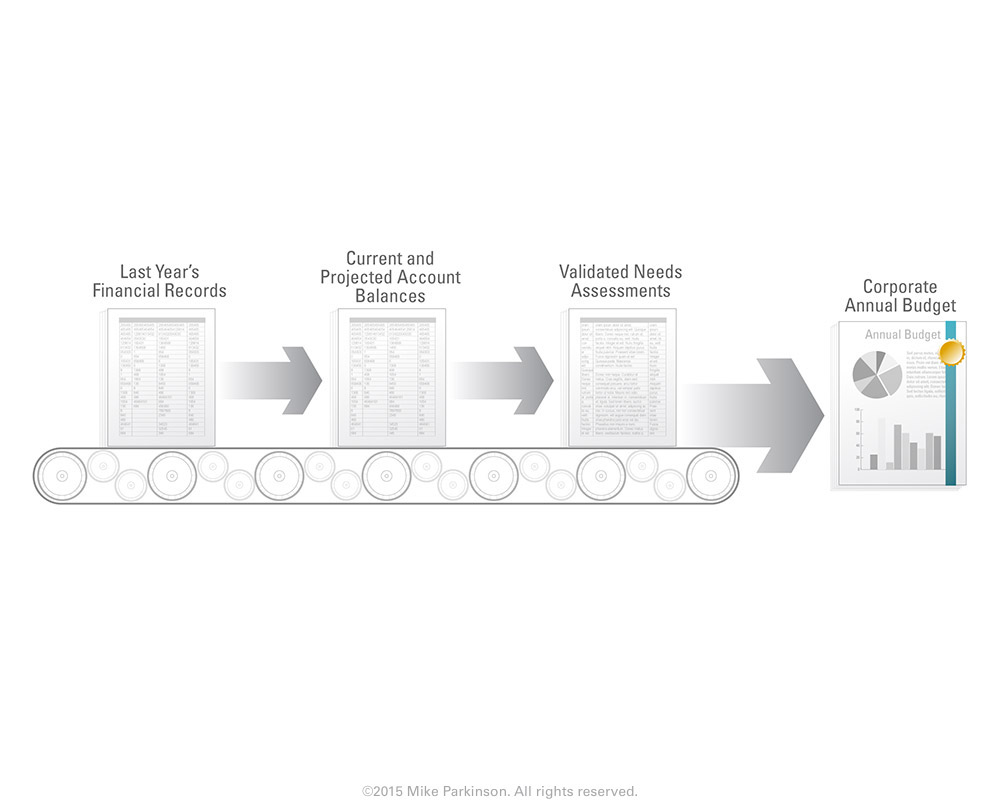
Use this Conveyor Belt Graphic to illustrate a repeatable linear process.
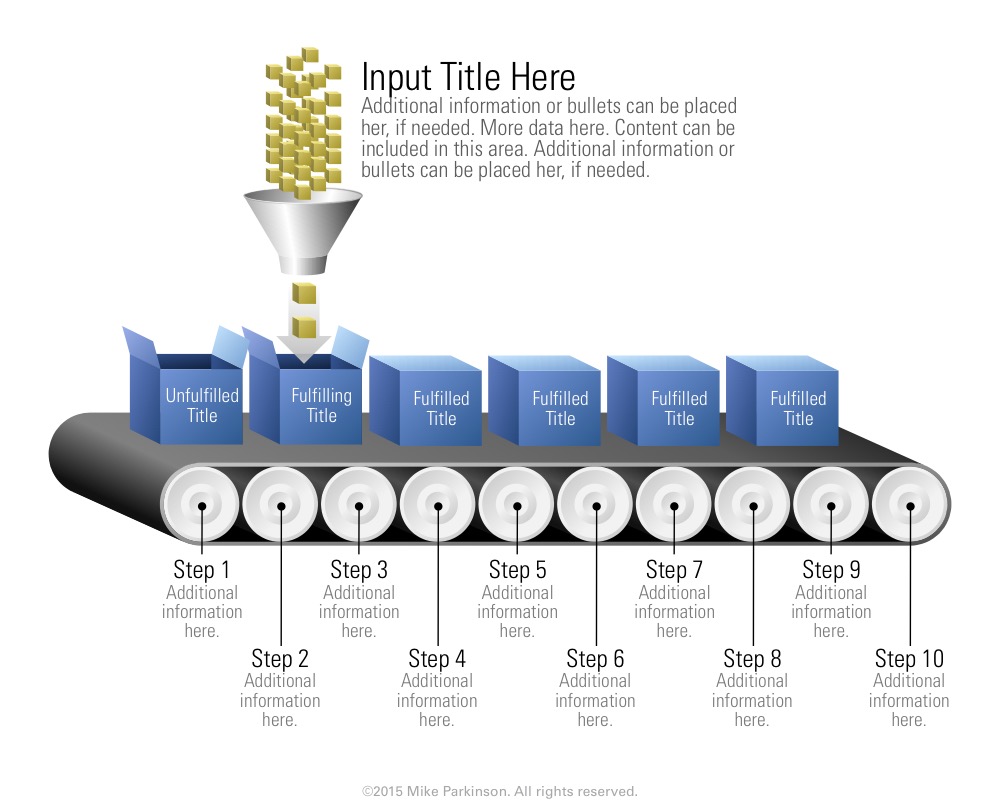
Use this Conveyor Belt Graphic to illustrate a repeatable linear process.
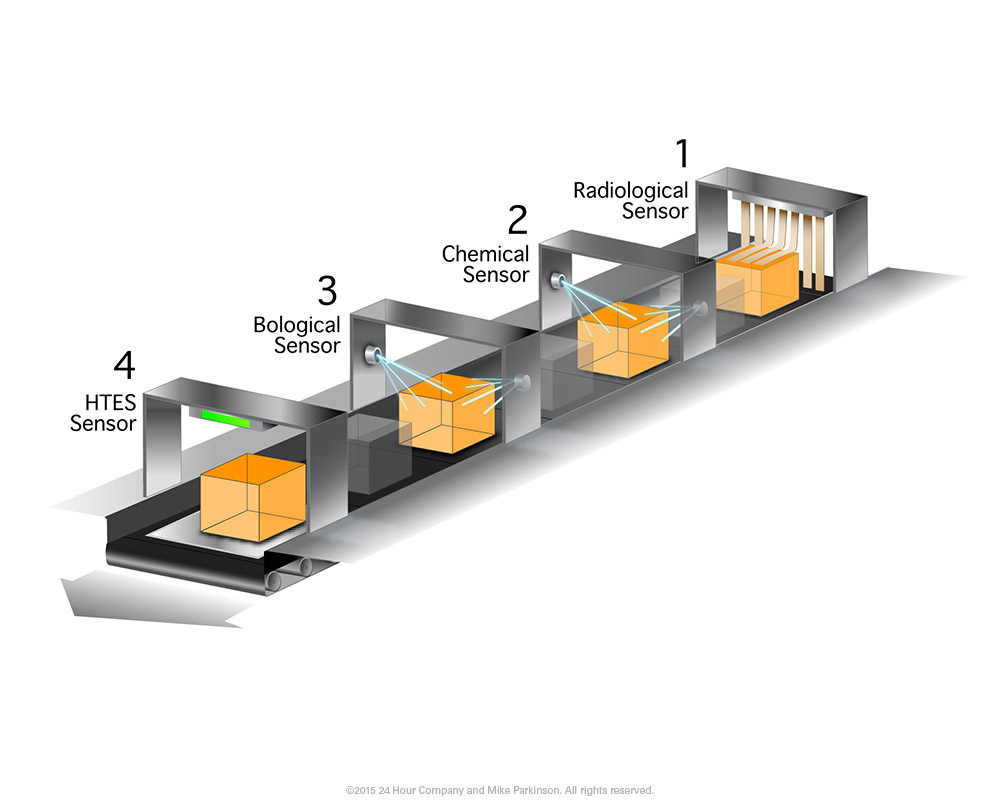
Use this Conveyor Belt Graphic to illustrate a repeatable linear process.
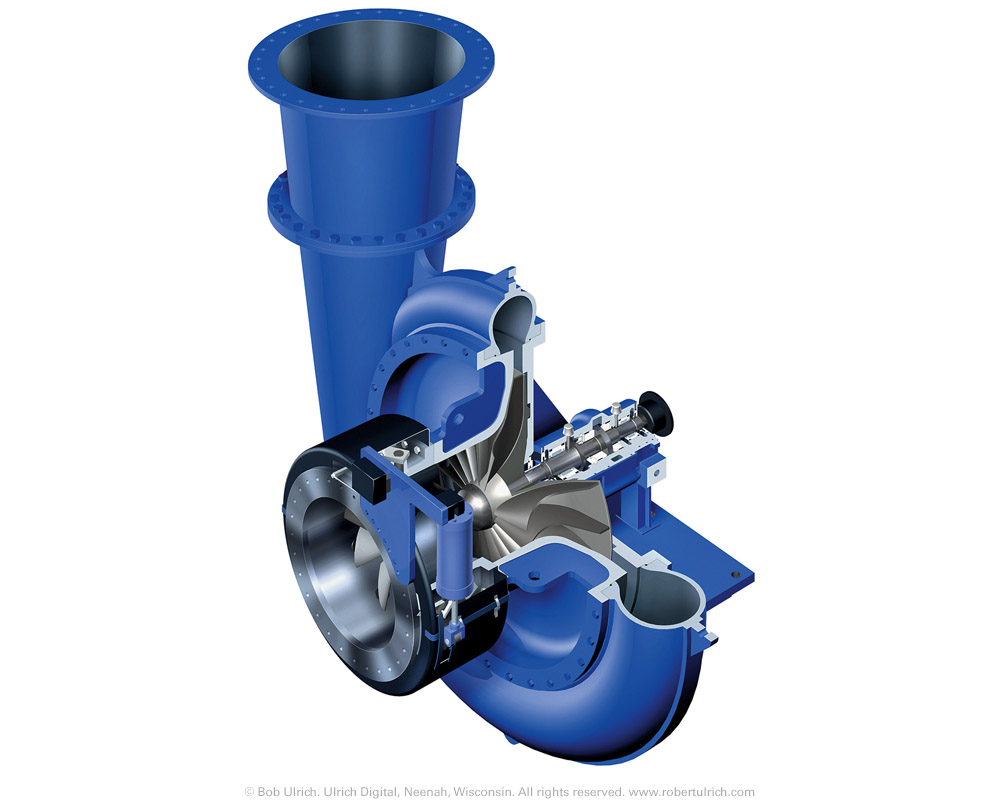
Use this Cutaway Diagram to show database solutions.
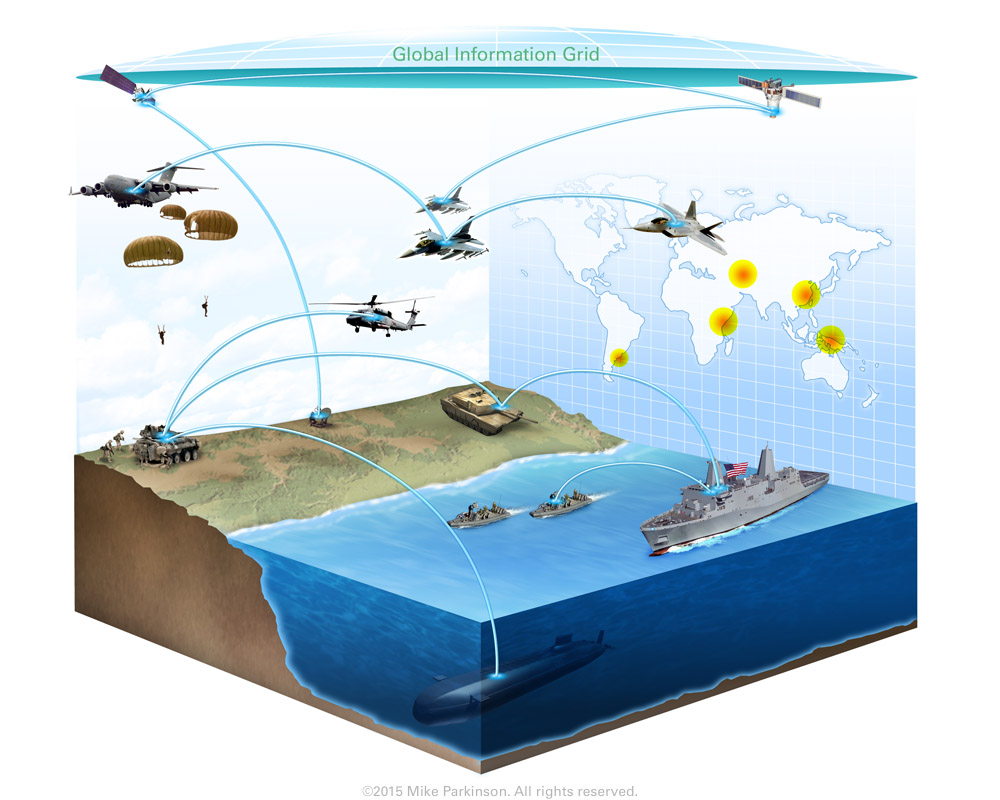
Use this “battle space” Cutaway Diagram to show communication and alignment between forces. Elements are raster with transparent backgrounds. Lines…
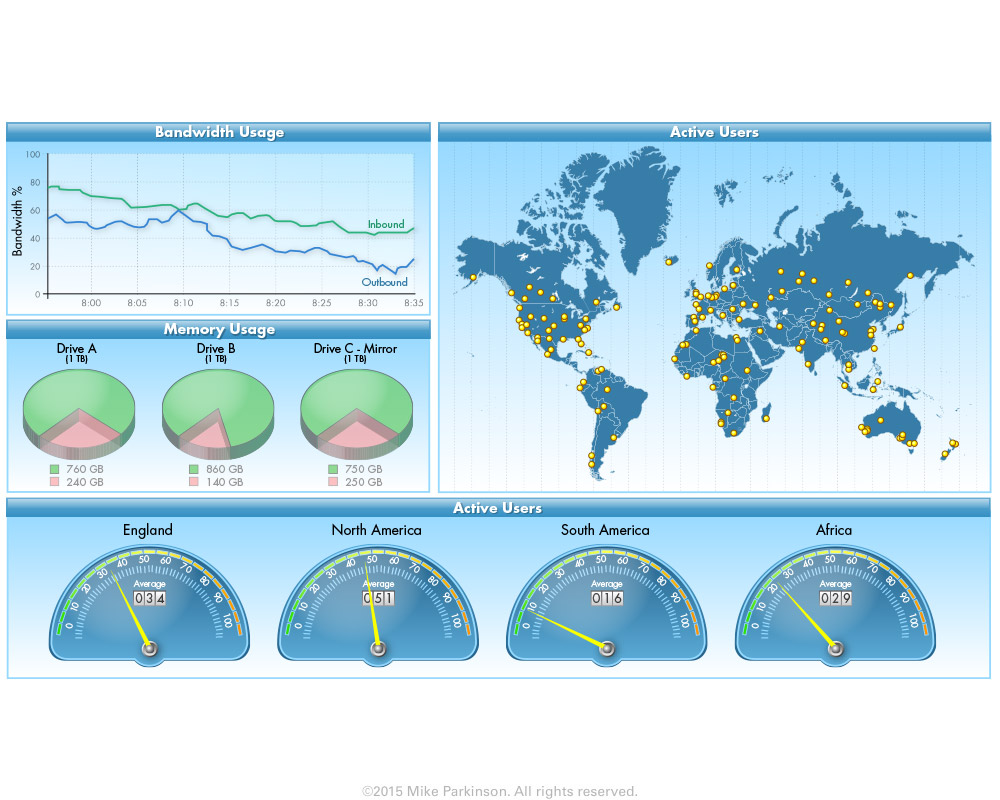
Use this Dashboard Graphic to show multiple metrics in one consolidated format. The line chart and pie charts are data…
Use this Dashboard Graphic to show multiple metrics in one consolidated format. The line chart and pie charts are data…
Use this Dashboard Graphic to show multiple metrics in one consolidated format. The line chart and pie charts are data…