Infographic 4
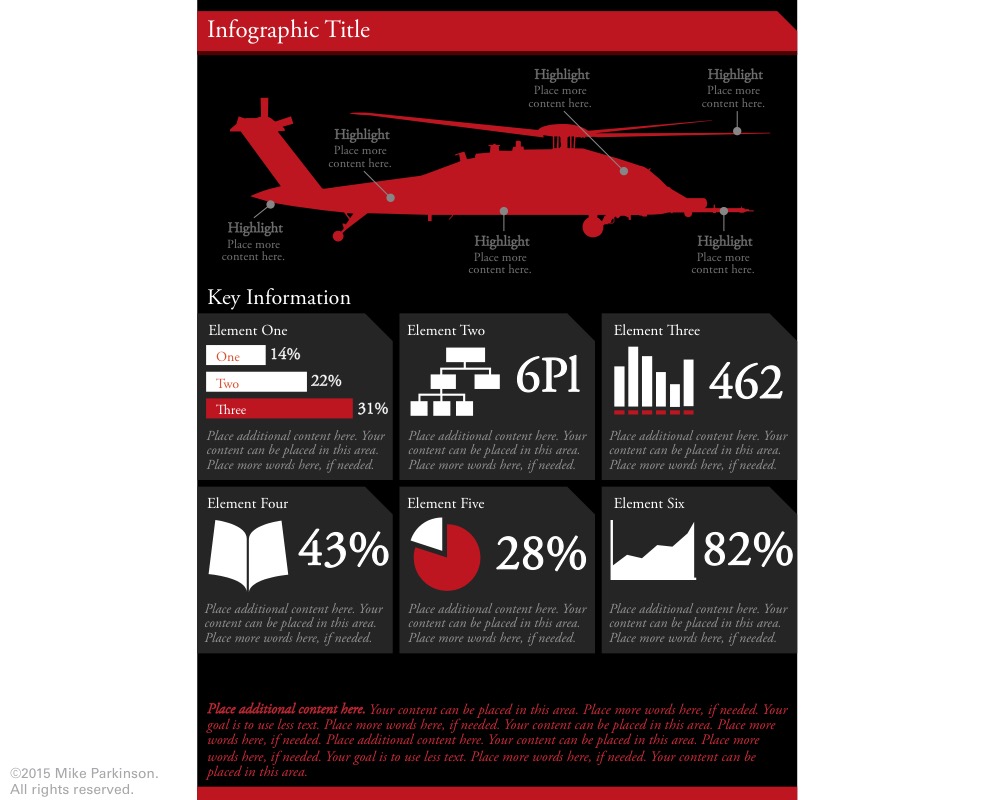
Use this Infographic to showcase interconnected information related to a specific topic.

Use this Infographic to showcase interconnected information related to a specific topic.
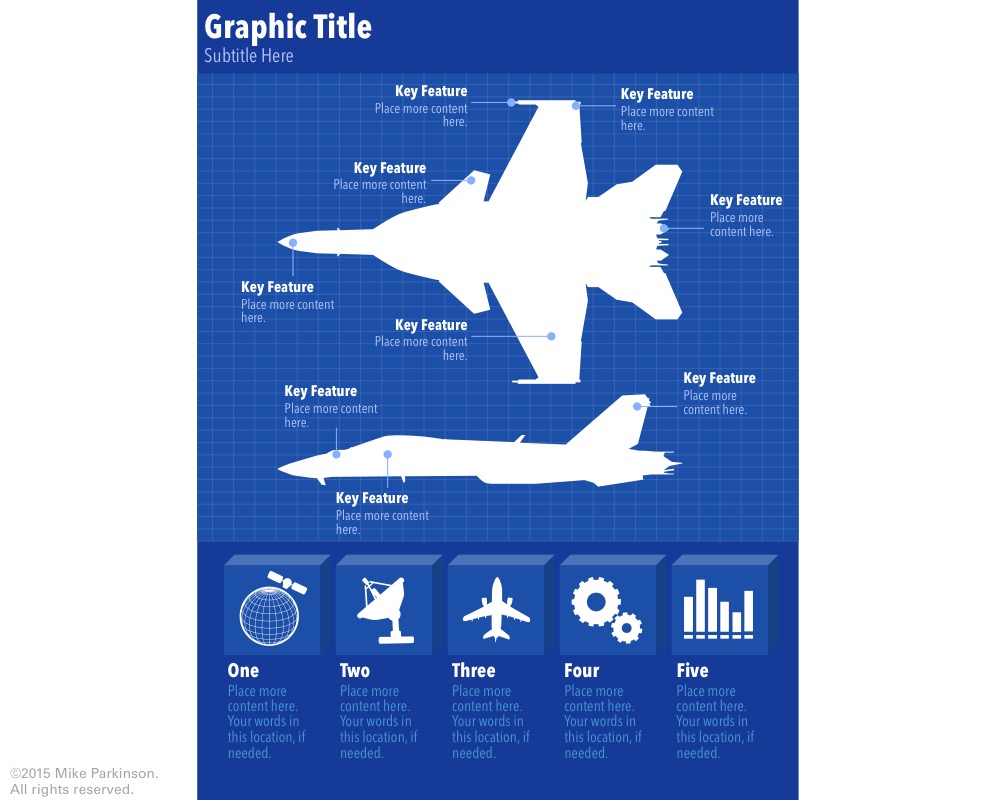
Use this Infographic to showcase interconnected information related to a specific topic.
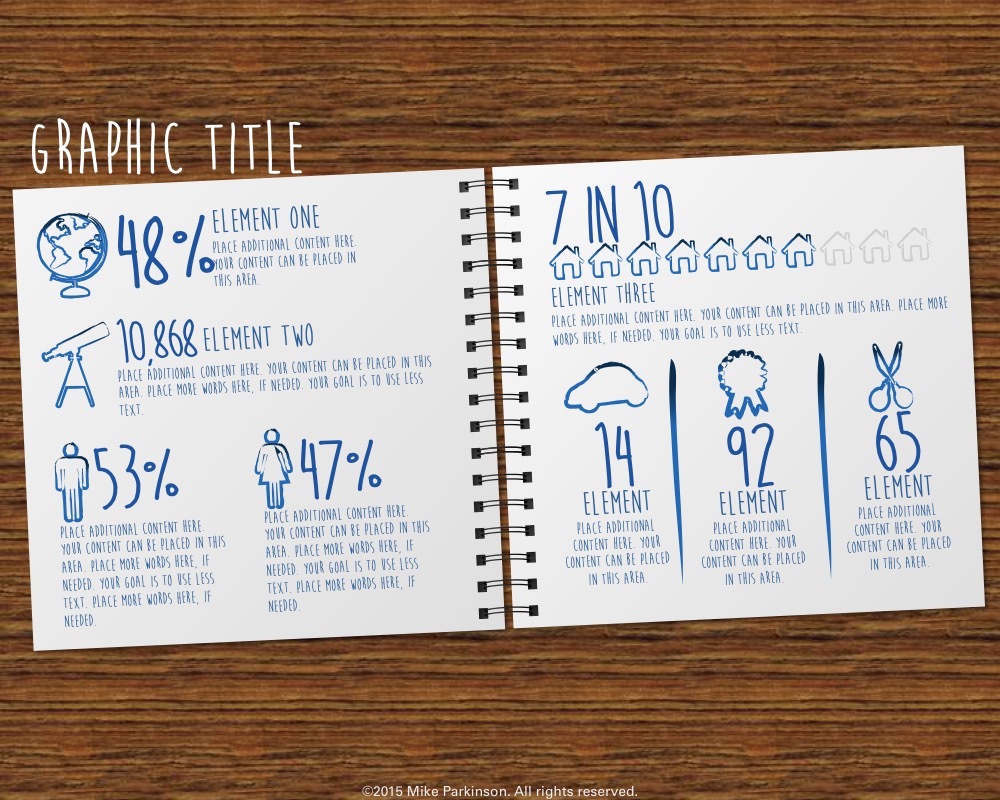
Use this Infographic to showcase interconnected information related to a specific topic.

Use this Infographic to showcase interconnected information related to a specific topic.
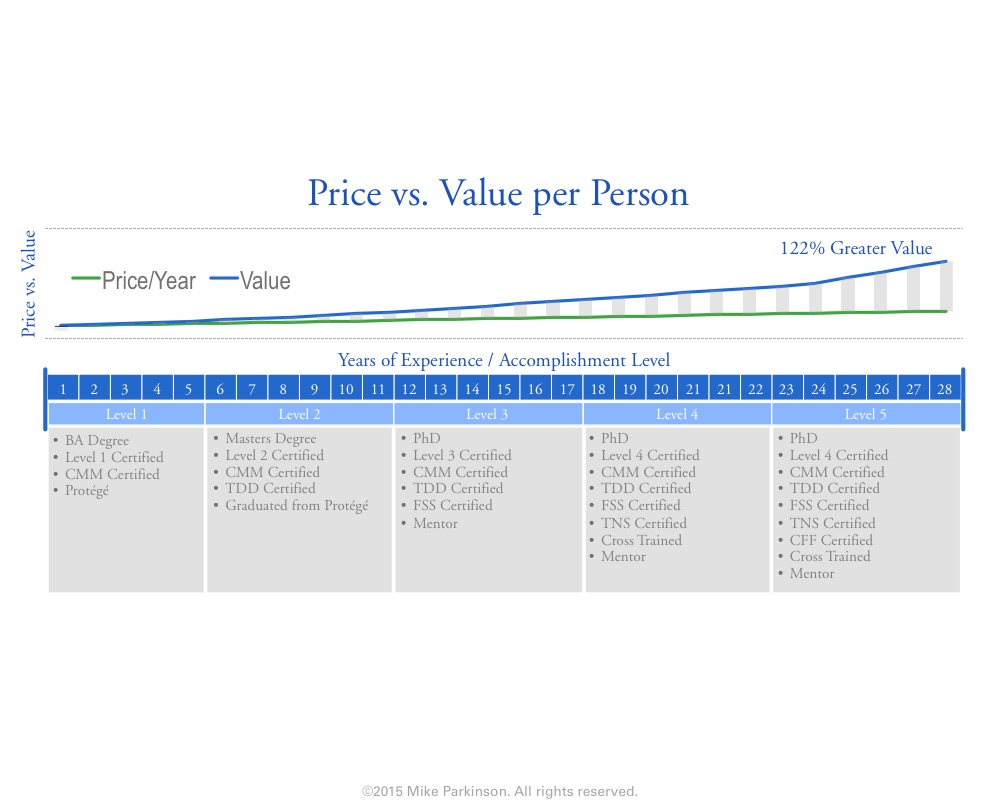
Use this Graph to show amounts, values, and time. This graphic is data driven.

Use this Graph to show amounts, values, and time. This graphic is data driven.
Use this Scale Graphic to show comparisons and as a metaphor for assessment, evaluation, and judgment. Includes two additional slides…