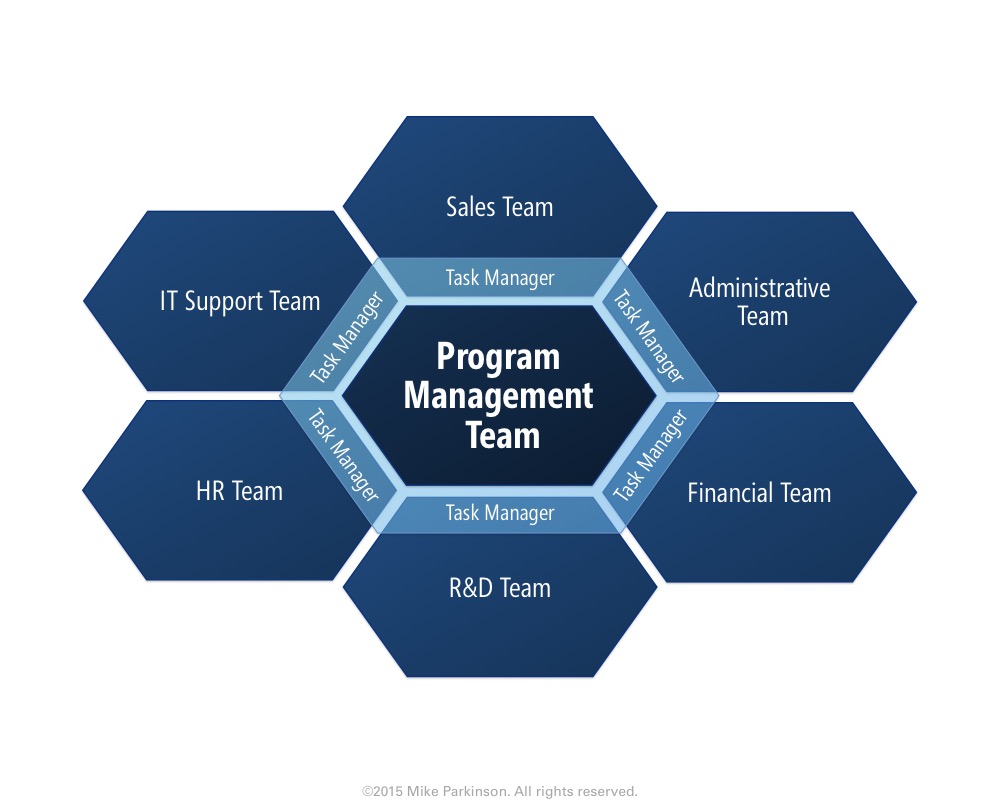
Organizational Chart 2
Use this Organizational Chart to depict hierarchy, arrangement, structure, and/or relationship of a group of elements (e.g., an organization and…

Use this Organizational Chart to depict hierarchy, arrangement, structure, and/or relationship of a group of elements (e.g., an organization and…
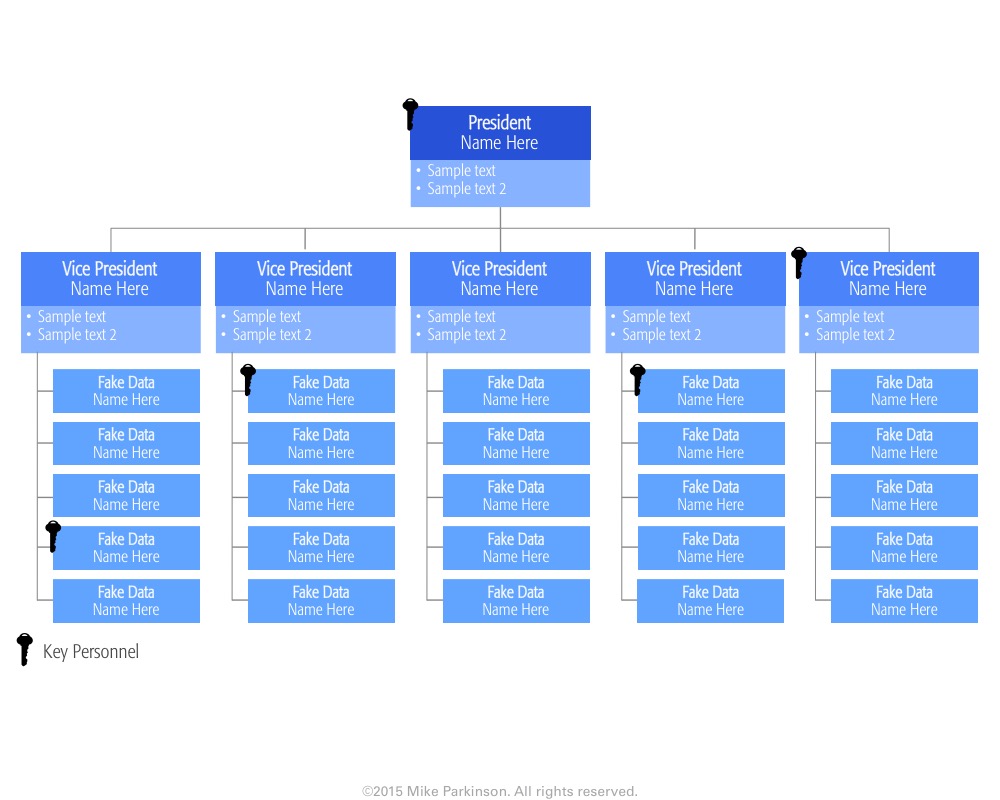
Use this Organizational Chart to depict hierarchy, arrangement, structure, and/or relationship of a group of elements (e.g., an organization and…
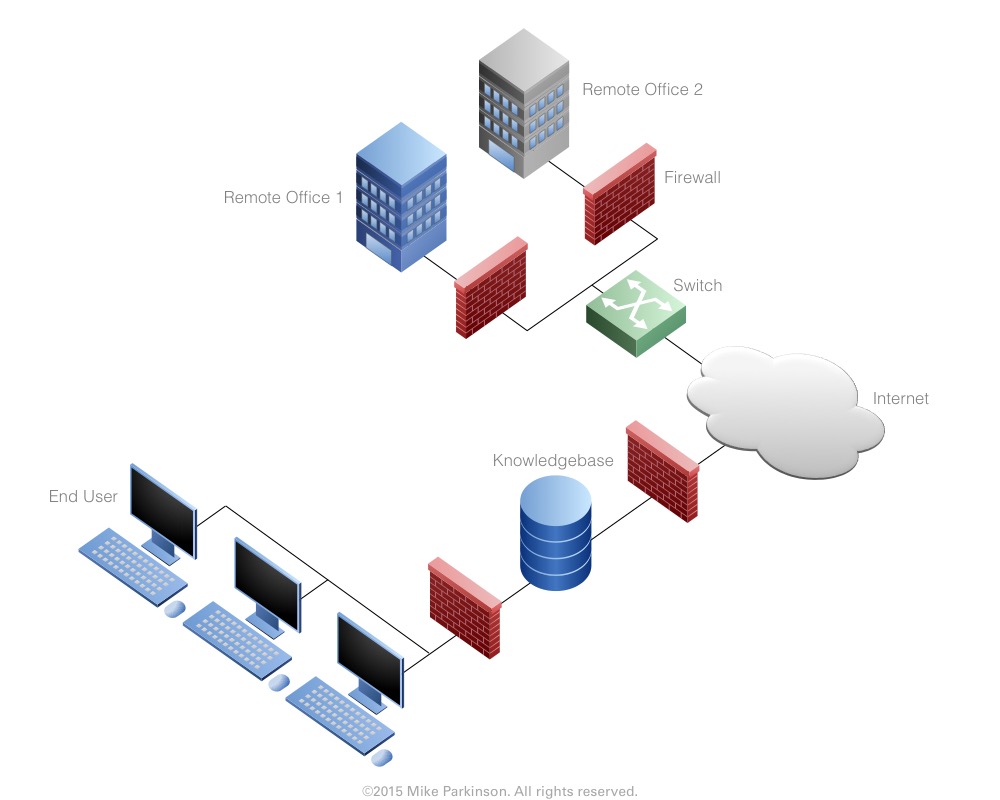
Use these Network Diagram icons and symbols to build your own Network Diagrams.
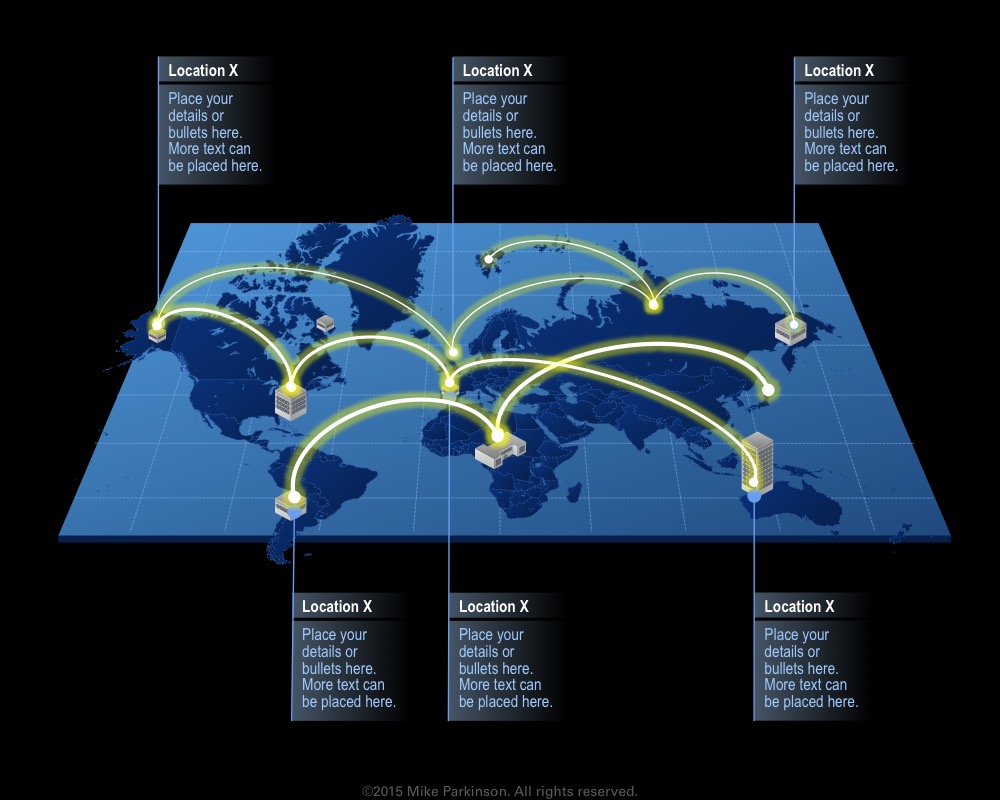
Use this graphic to show regions, countries, cities, and locations of your offices, headquarters, corporate reach, bases, etc.
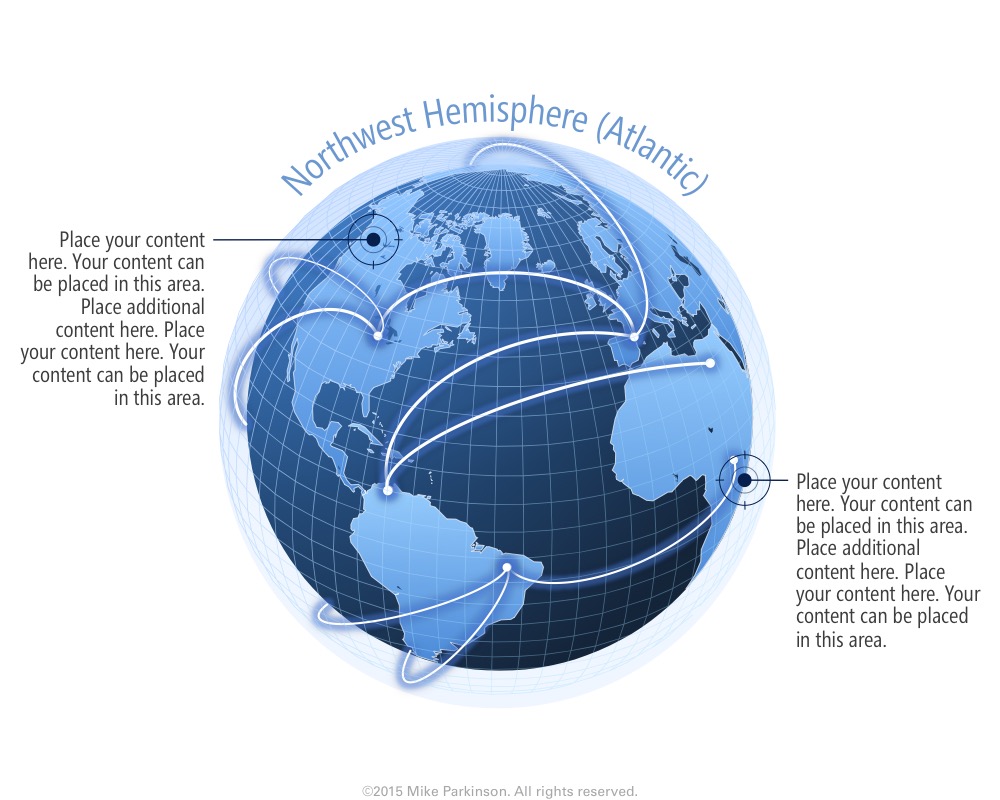
Use this graphic to show regions, countries, cities, and locations of your offices, headquarters, corporate reach, bases, etc.
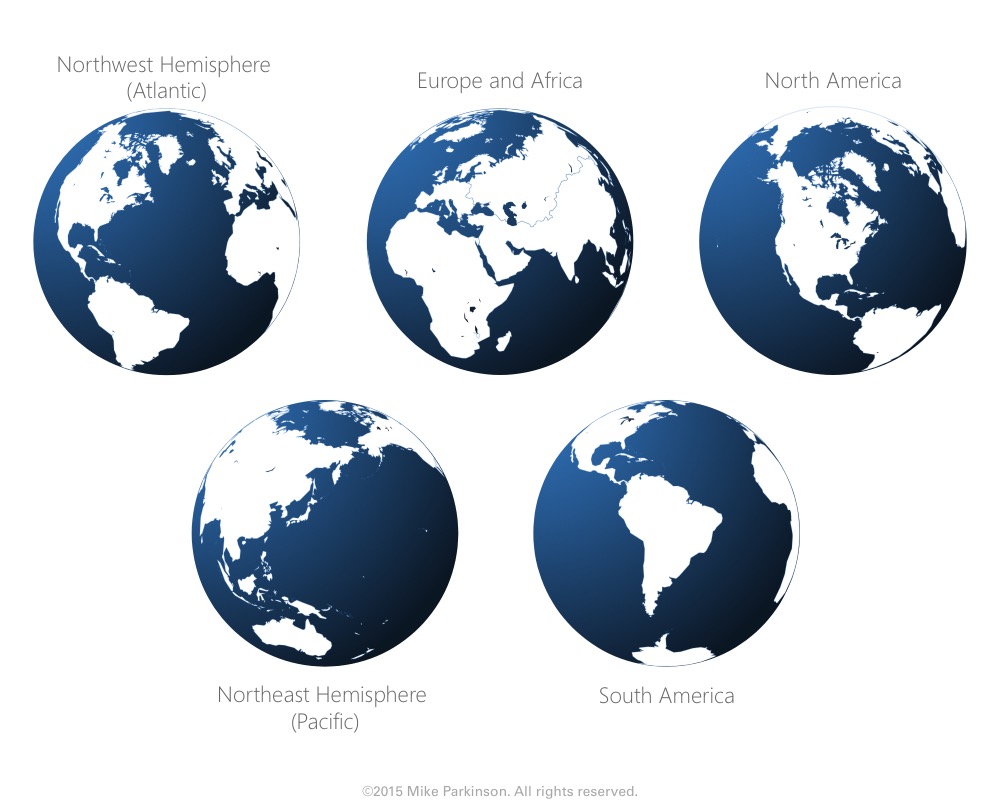
Use this graphic to show regions, countries, cities, and locations of your offices, headquarters, corporate reach, bases, etc.
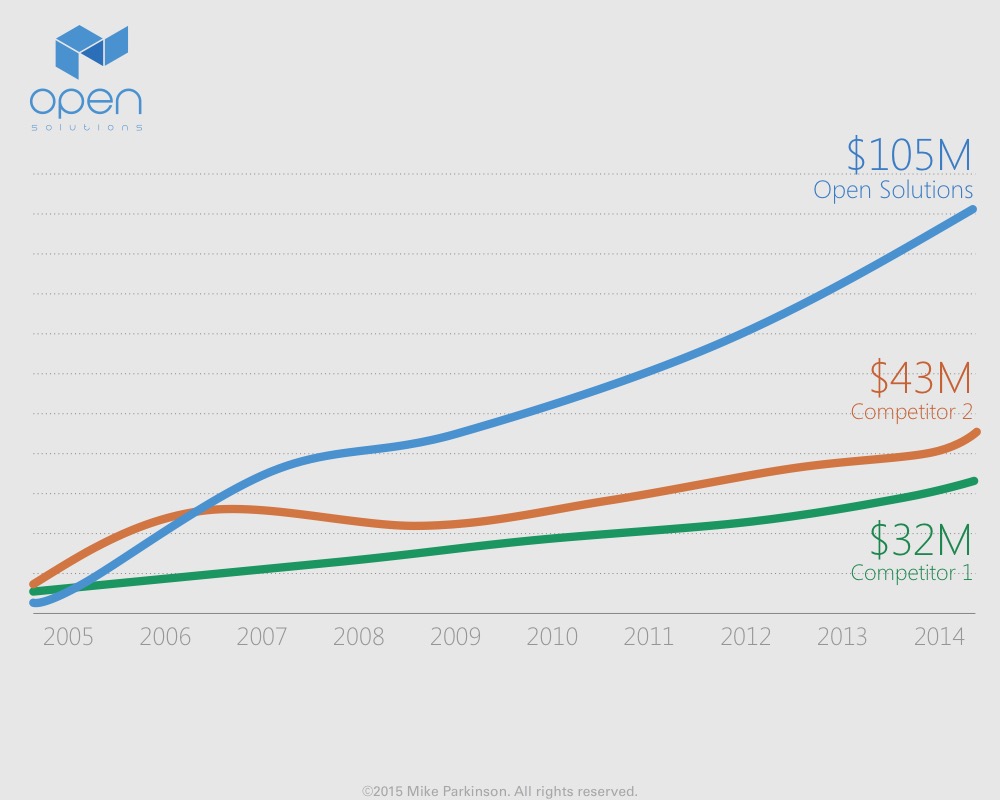
Use this Line Chart/Bar Chart hybrid to show quantitative data. This graphic is data driven.
Use this Line Chart/Bar Chart hybrid to show quantitative data. This graphic is data driven.
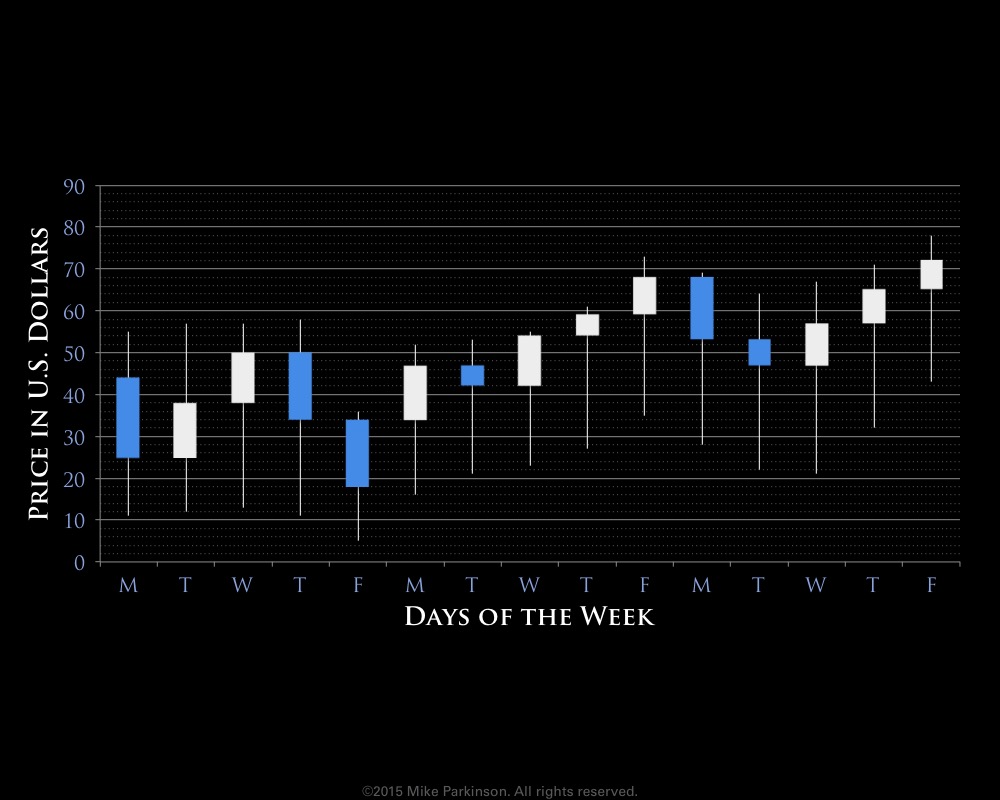
Use this Candlestick Chart to show changes in value and other information pertaining to stocks, bonds, commodities, etc. This graphic…
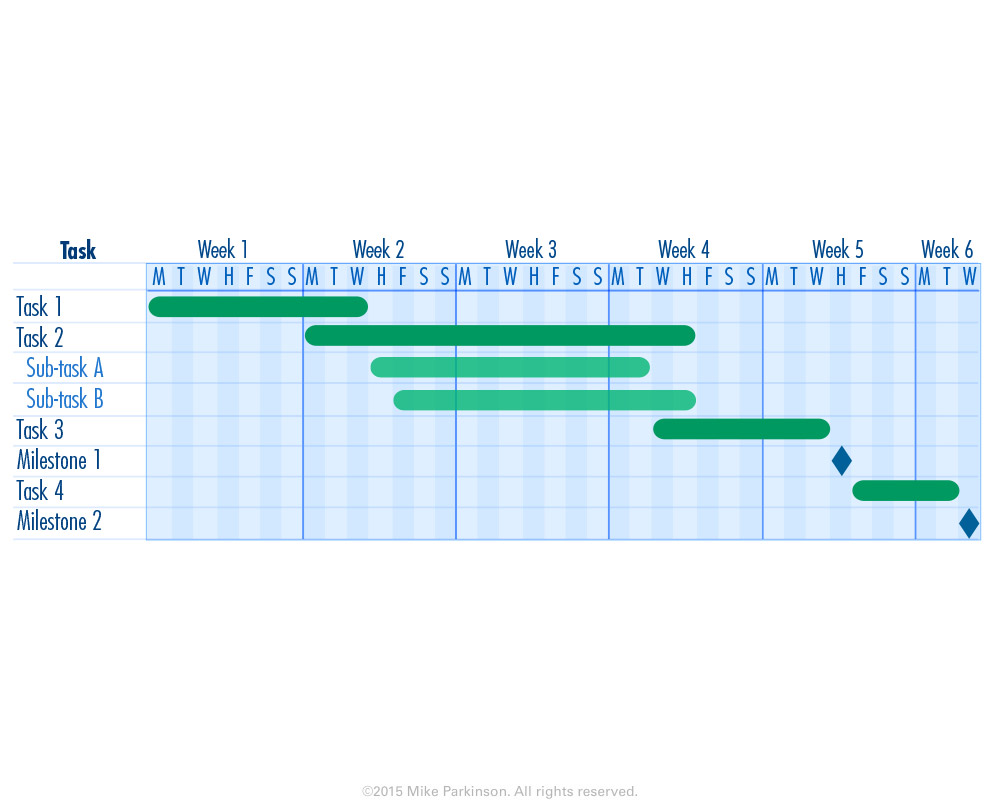
Use this Gantt Chart to communicate schedule and activity for tracking, planning, review purposes. (This chart is NOT data driven.)
Use this Timeline to show dates for any month. Highlight the month and days and use the blowouts for detail.
Use this Timeline to show dates for any month. Highlight the month and days and use the blowouts for detail.