Process Diagram 6
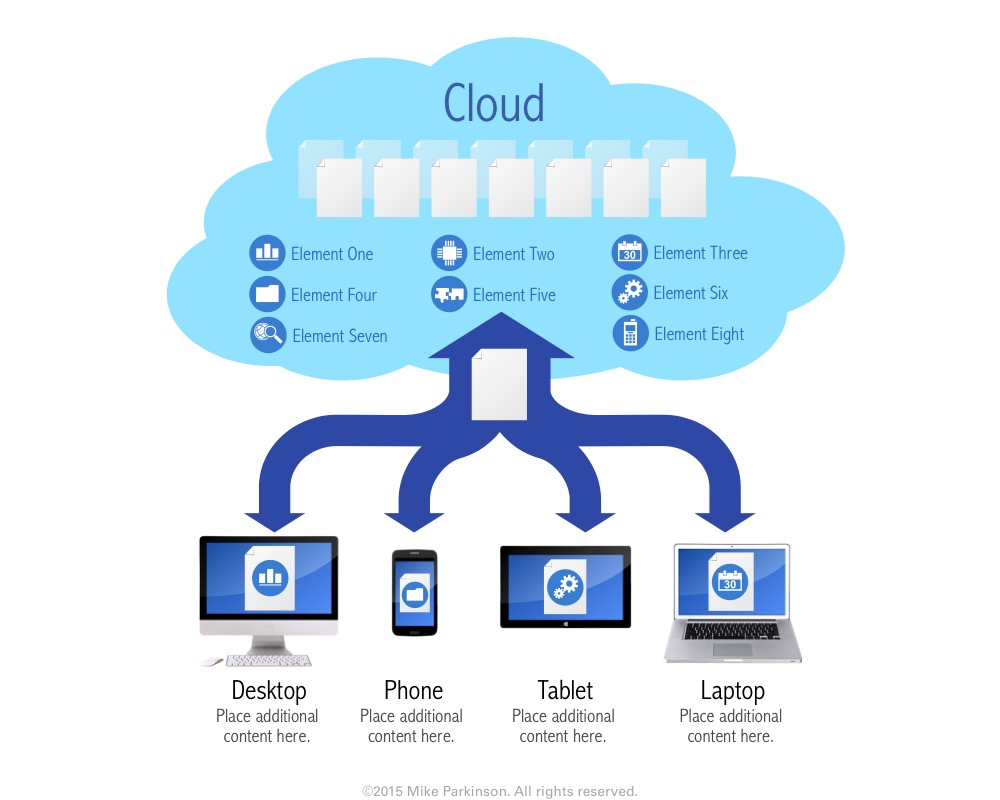
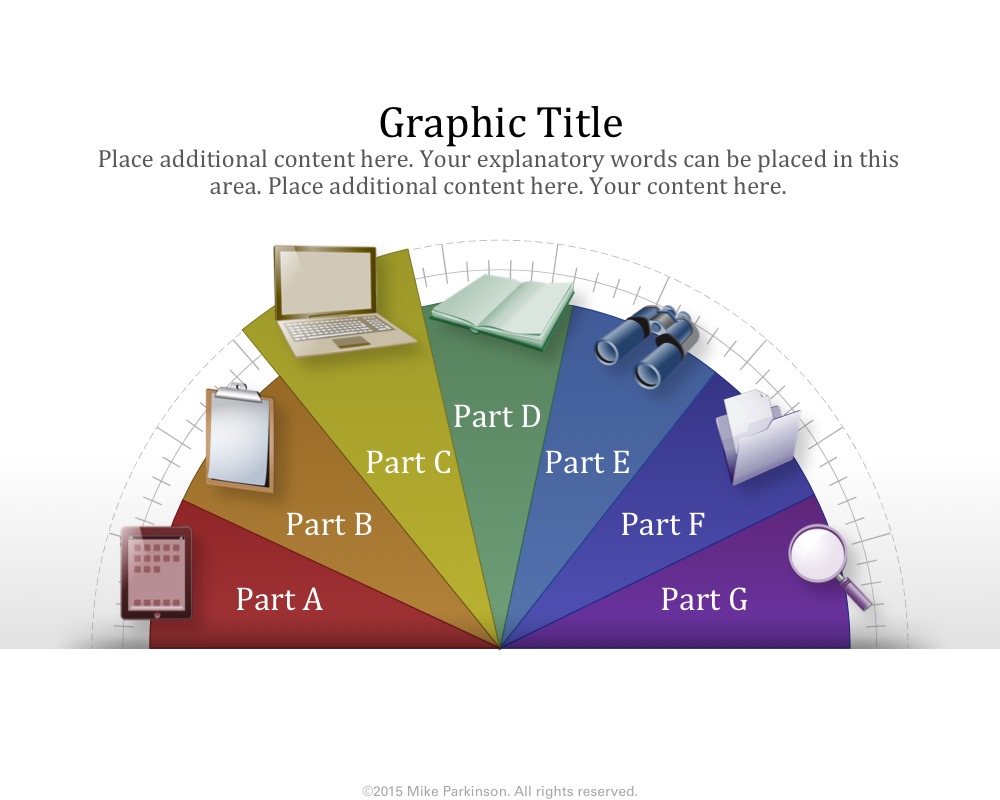
Use this Process Diagram to show relationships, influences, and interactions.

Use this Process Diagram to show relationships, influences, and interactions.

Use this Process Diagram to show relationships, influences, and interactions.
Use this Process Diagram to show relationships, influences, and interactions.
Use this Process Diagram to show relationships, influences, and interactions.

Use this Process Diagram to show relationships, influences, and interactions.
Use this Process Diagram to show relationships, influences, and interactions.
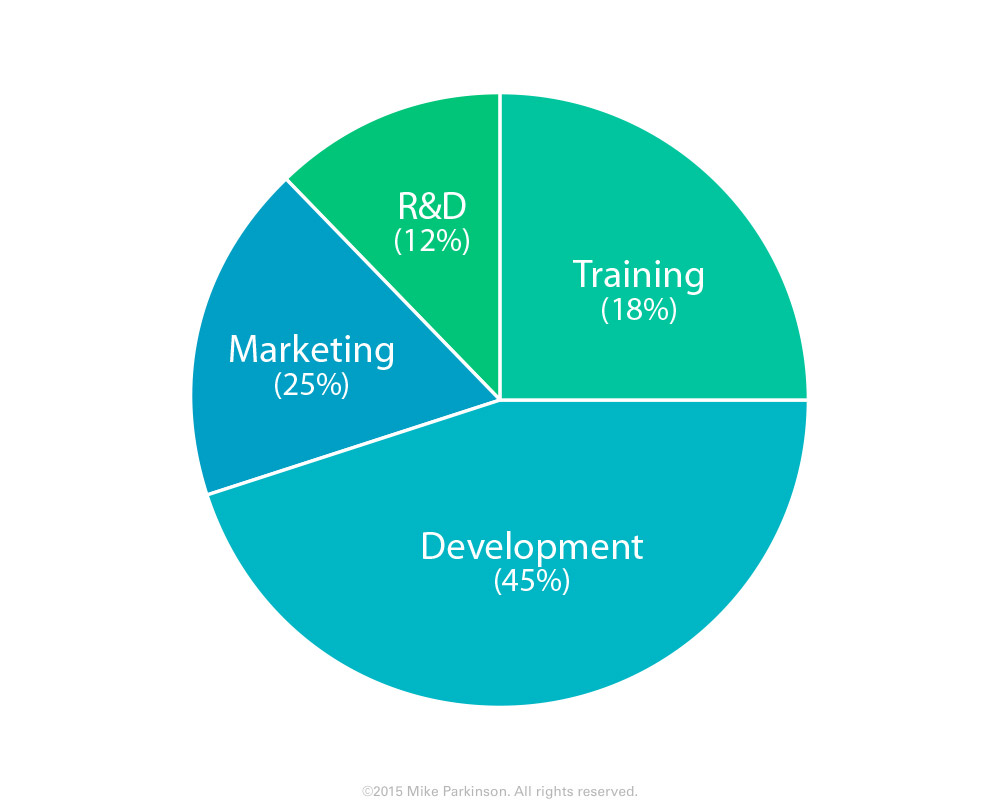
Use this Pie Chart to show percentages relative to the whole.
Use this Pie Chart to show percentages relative to the whole.
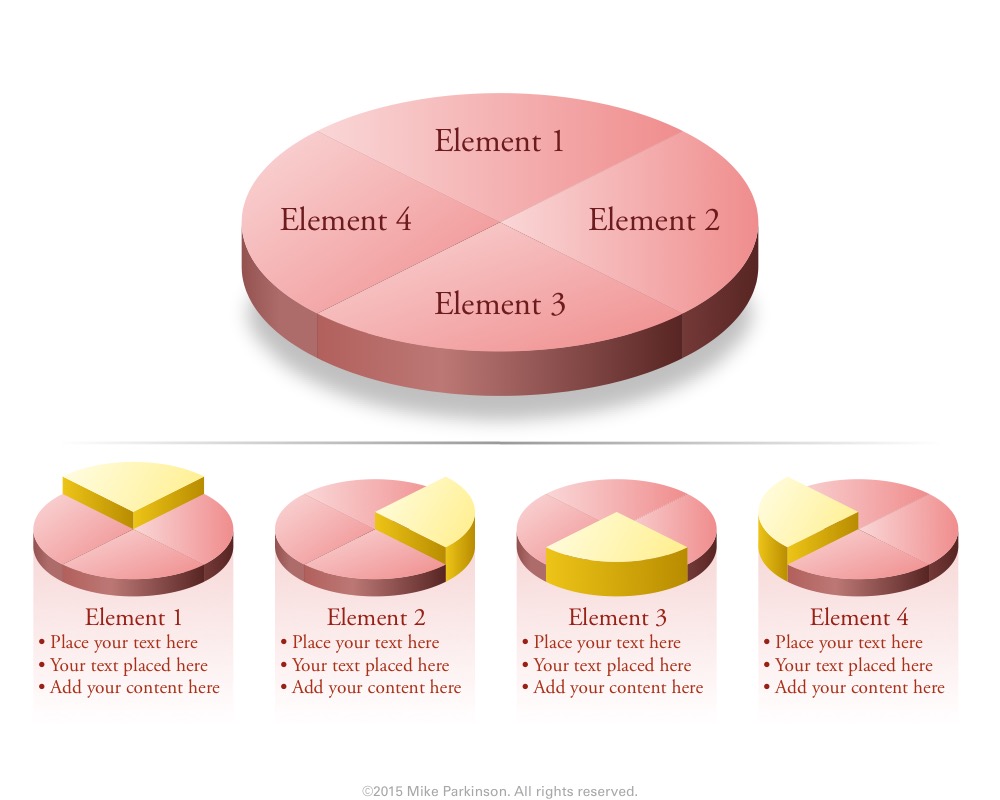
Use this Pie Chart to show percentages relative to the whole.
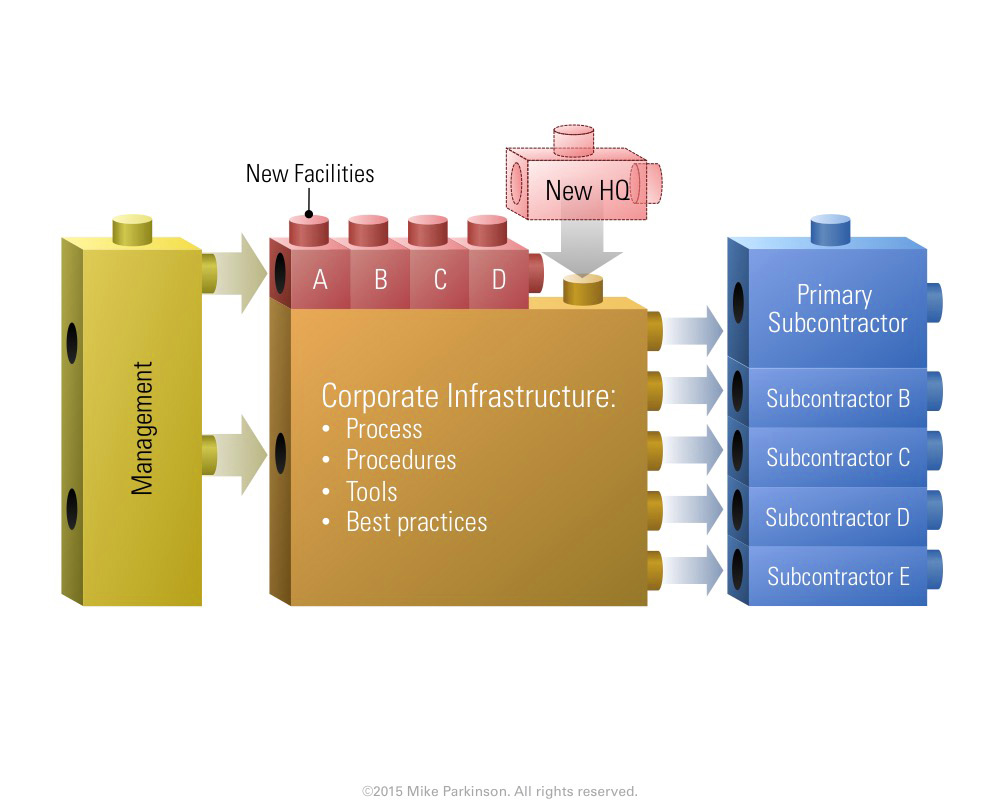
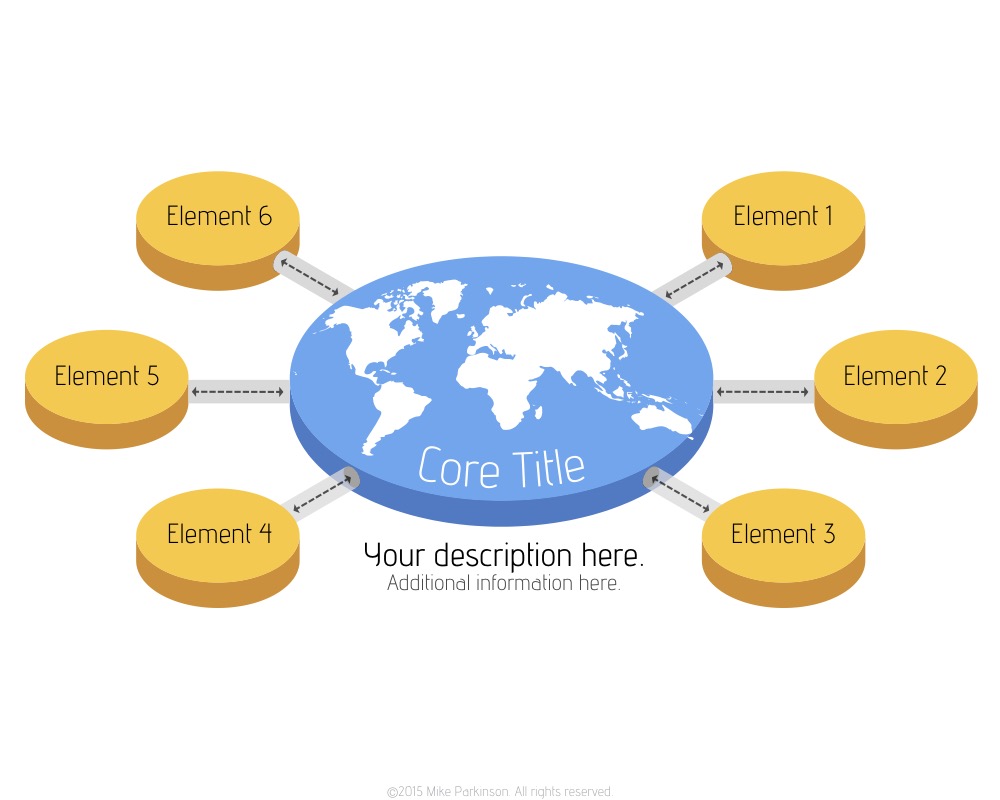
Use this Peg Graphic to show interconnectivity of entities or ideas to create a unified whole (think "Legos").
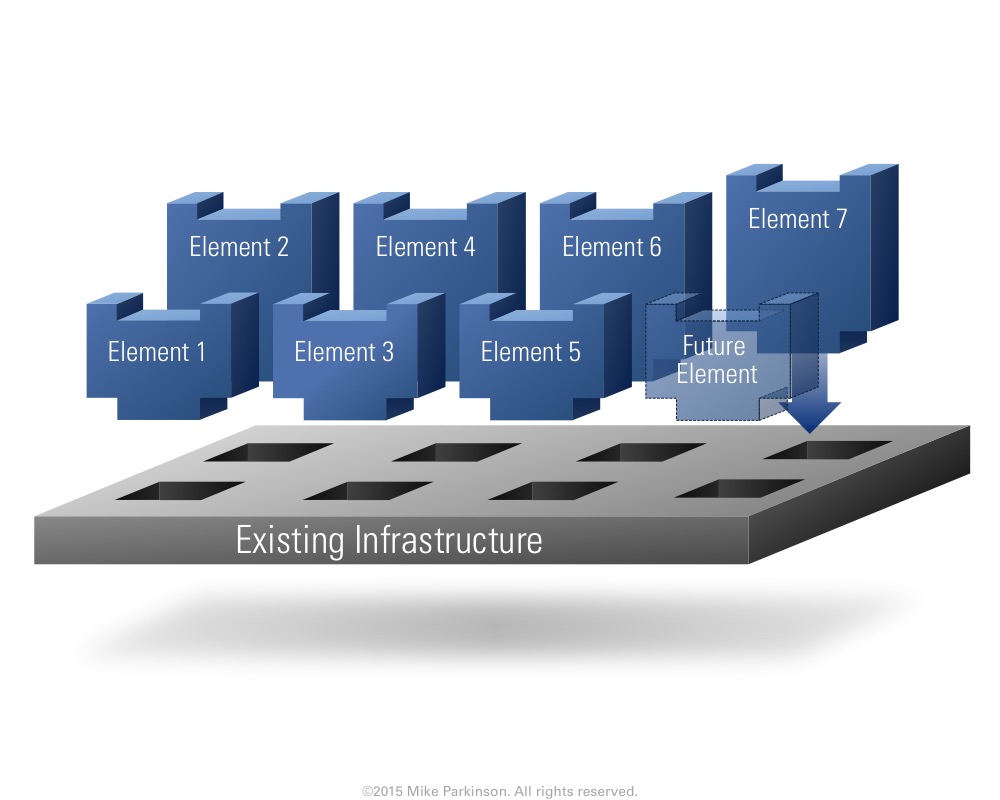
Use this Peg Graphic to show interconnectivity of entities or ideas to create a unified whole (think "Legos").

Use this Organizational Chart to depict hierarchy, arrangement, structure, and/or relationship of a group of elements (e.g., an organization and…